
Join Our Telegram channel to stay up to date on breaking news coverage
The bears’ momentum is decreasing in Holo market
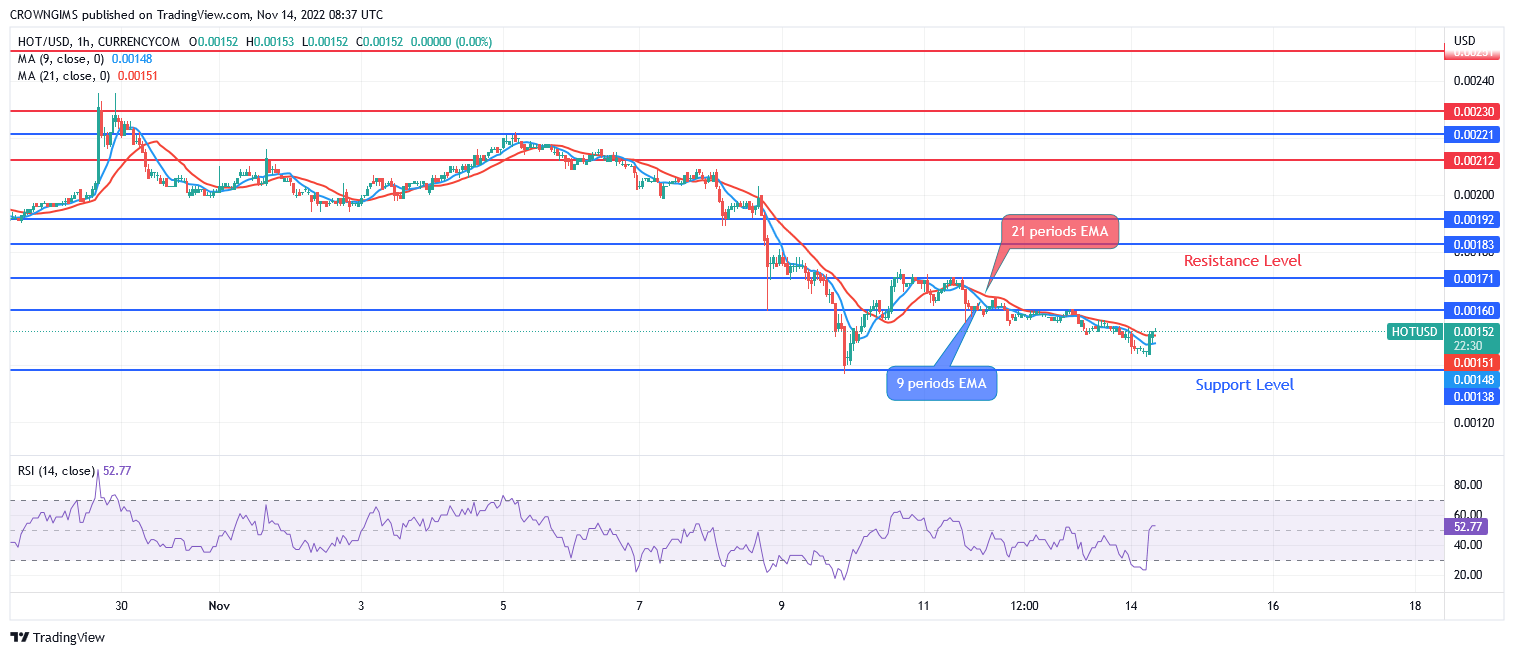
HOTUSD Price Analysis – 14 November
When there is an increase in the bears’ momentum, the price may decrease below $0.0013 and may extend to $0.0011 and $0.0010 support levels. In case the support level of $0.0015 holds, Holo may bounce up and change direction toward the resistance level at $0.0016, $0.0017, and $0.0018.Key levels:
Resistance levels: $0.0016, $0.0017, $0.0018
Support levels: $0.0013, $0.0011, $0.0010
HOTUSD Long-term Trend: Ranging
HOTUSD is bearish on the daily chart. The crypto was consolidating within the resistance level of $0.0023 and $0.0018 levels. On November 08, sellers gathered enough momentum and the support level of $0.0018 was a broken downside. Sellers further increased their speed with the formation of the daily solid bearish candles. The price declines to the support level at $0.0013. It pulled back to retest $0.0016 on November 10. At the moment, the coin is facing its previous low at $0.0015 which may be a broken downside.
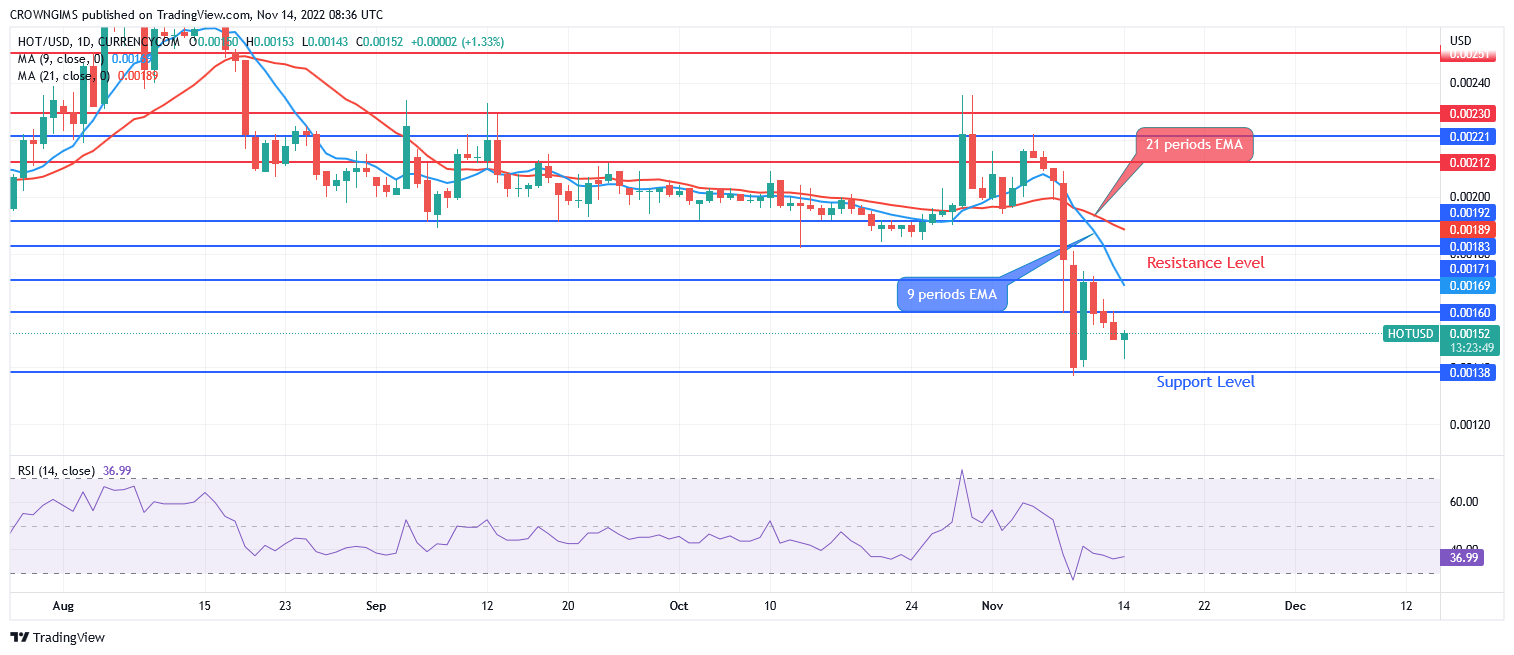
The fast Moving Average (9-periods) is already crossed the slow Moving Average (21-periods EMA) downside and the price is trading below the two EMAs as a sign of bearish movement. When there is an increase in the bears’ momentum, the price may decrease below $0.0013 and may extend to $0.0011 and $0.0010 support levels. In case the support level of $0.0015 holds, the price may bounce up and change direction toward the resistance level at $0.0016, $0.0017, and $0.0018. The relative strength index period 14 is pointing up at 37 levels to indicate a buy signal.
HOTUSD medium-term Trend: Bearish
HOTUSD is bearish in the 4-hour chart. The resistance level of $0.0023 rejected the price increase on 29 October. There was a formation of an inverted pin bar at the mentioned level; this indicates a price reversal. The price obeyed and declines to $0.0013. The price pulled back to retest $0.0016. At the moment, the price action is trying to form a double-bottom chart pattern.
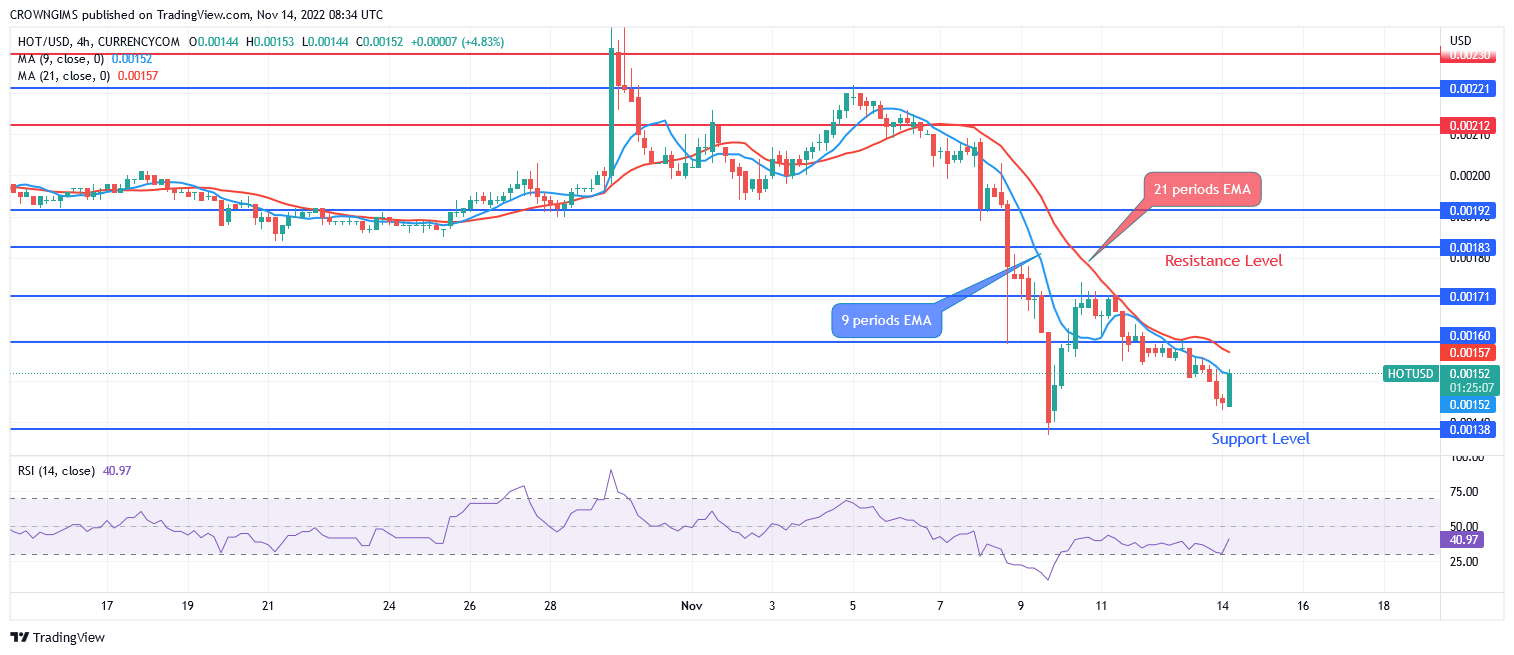
The 9-periods EMA and 21-periods EMA are separated from each other and the price is trading below the two EMAs, which indicates bearish movement. The relative strength index period 14 is at 44 levels and the signal lines point up to indicate a buy signal.
The IMPT Token Presale Offers a Rare Investment Opportunity
At the moment, the Impact Token presale is ongoing. Within weeks, this digital asset has realized nearly $13 million in the ongoing presale.
After Presale, D2T Will Be Listed on Bitmart
Dash 2 Trade (D2T) is selling faster than expected, D2T token has acquired $6m for the development of the platform in future. D2T will be listed on Bitmart soon after presale.
Related
Join Our Telegram channel to stay up to date on breaking news coverage