Join Our Telegram channel to stay up to date on breaking news coverage
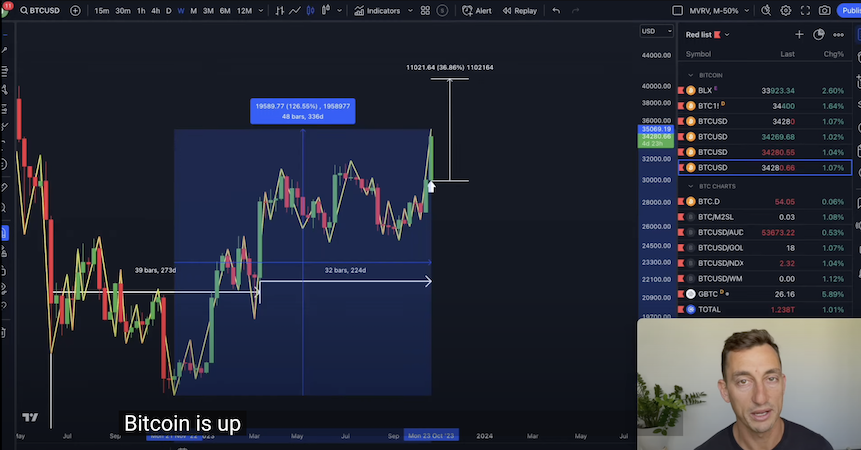
Bitcoin’s remarkable recovery, surging by 126% from its cycle low in November 2022, has grabbed the attention of the crypto community. In his most recent video posted on his channel, known YouTuber Jason Pizzino talks about a historically significant indicator, the MVRV (Market Value to Realized Value). This indicator has flipped to a positive state, suggesting notable implications for Bitcoin’s trajectory. As the data unveils some prominent patterns, it’s essential for investors to comprehend these movements and what they could mean for the future.
Here are some of the key insights from Jason’s video. You can watch the entire video at the link below.
Historic MVRV Pattern
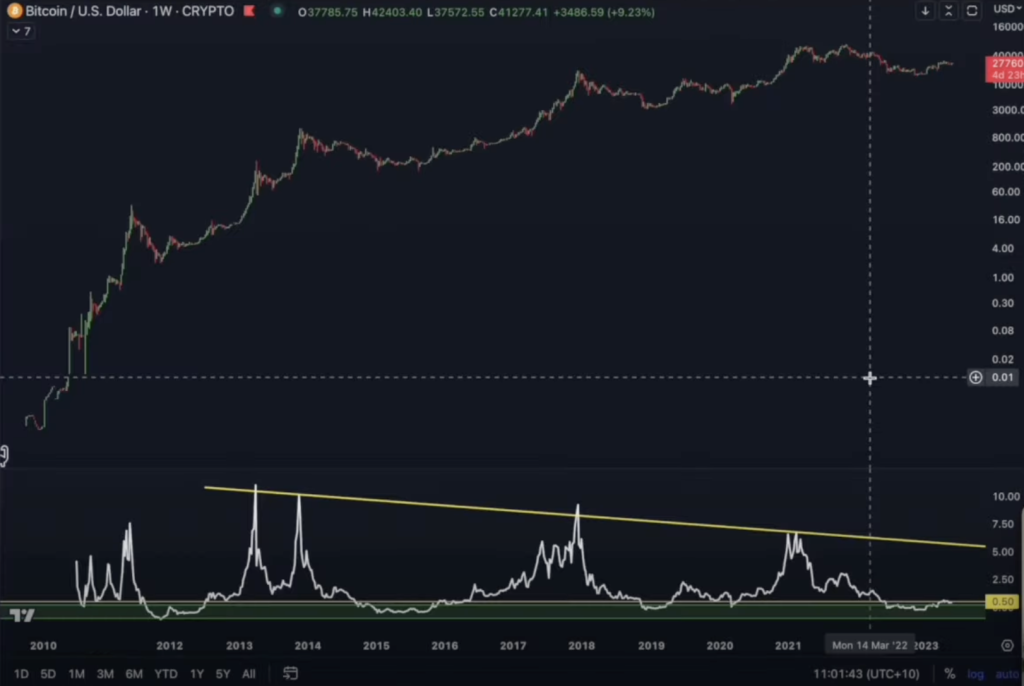
This indicator flipping positive has traditionally meant that it doesn’t revert until the subsequent bear market. Those investors who have been patiently waiting for Bitcoin to surpass the $19,000 or $20,000 mark, hoping it also breaches its cycle low, might face significant disappointment.
Ripple Effects on Other Markets
Bitcoin’s potential upside will likely ripple over to the altcoin market. Furthermore, the stock market and real estate sector are also showing signs of basing out and possibly continuing their uptrends.
The Threat of a Mega Collapse
While short-term data, even extending into 2024, suggests an upward market trend, there are warnings of a potential massive collapse in the coming years.
Stock Market’s Influence on Crypto
A rising stock market typically indicates an influx of new money into the crypto realm. The S&P 500’s trajectory has shown patterns that reflect bullish sentiments, with the market displaying higher highs and higher lows, indicative of an uptrend.
Technical Bull Market
For a market to technically be termed as ‘bull’, it must show rises of over 20% from its lows. Both the S&P 500 and NASDAQ display these traits, with the latter particularly buoyed by the performance of the top seven tech stocks.
Bitcoin and the MVRV
32 weeks ago, Bitcoin broke out of an accumulation zone, post the banking crisis. The MVRV serves as a tool to gauge potential future movements. Historically, after the MVRV turns positive, it’s been a rare occurrence for it to fall back into the accumulation zone, suggesting a possible upward trajectory for Bitcoin.
Projecting Forward with the MVRV
From historical patterns, once Bitcoin breaks out from the MVRV’s green zone, it can take between 154 to 164 weeks (approximately 3 years) before it reenters. This could project a peak, followed by a bear market, around February to May of 2026.
Final Thoughts
The takeaway for investors from the discussion centered on the MVRV and related indicators is clear: While current indicators are positive and pointing towards further gains in the short to medium term, it’s crucial to be aware of the cyclical nature of markets and the potential for downturns. Avoiding the “fear porn” and focusing on technicals, understanding market trends, and staying informed can be key to making informed investment decisions in this volatile landscape.
Related News
- Bitcoin Surpasses $35,000 Mark with Shorts Liquidation Totaling $114 Million
- Bitcoin Breaks $30K Amid Rising Optimism Over Imminent ETF Approvals After SEC’s Ripple “Capitulation’’ – And That Indicates Boom Times For Bitcoin Minetrix
- The Cooling Love Affair Between Institutional Investors and Ethereum
- Galaxy Digital Founder Says Bitcoin ETF ‘Essential’
Best Wallet - Diversify Your Crypto Portfolio
- Easy to Use, Feature-Driven Crypto Wallet
- Get Early Access to Upcoming Token ICOs
- Multi-Chain, Multi-Wallet, Non-Custodial
- Now On App Store, Google Play
- Stake To Earn Native Token $BEST
- 250,000+ Monthly Active Users
Join Our Telegram channel to stay up to date on breaking news coverage


