
Join Our Telegram channel to stay up to date on breaking news coverage
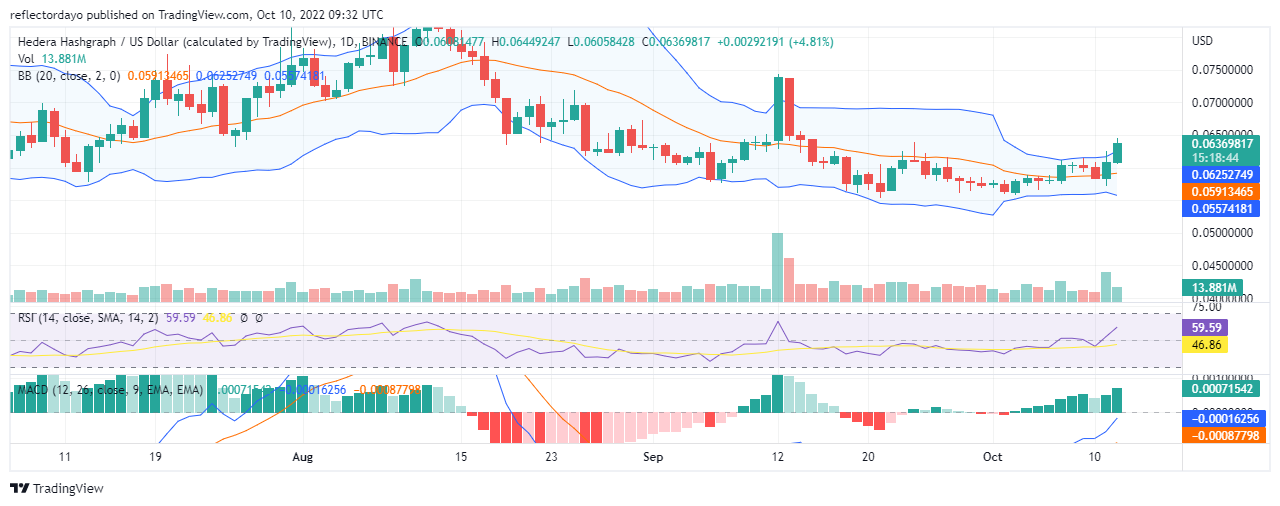
Hedera Hashgraph found its support at $0.0559 on the 2nd and 3rd of October for an upward performance of the market. But, by the 5th and the 6th of October, the market was faced with price gridlock between the buyers and the sellers. However, the buyers prove stronger as the bearish resistance could not stop the price from rising
Hedara Hashgraph Market Price Statistic:
- HBAR/USD price now: $0.0636
- HBAR/USD market cap: $1,461,718,570
- HBAR/USD circulating supply: 22.97 Billion
- HBAR/USD total supply: 50,000,000,000
- HBAR/USD coin market ranking: #37
Key Levels
Resistance: $ 0.065, $0.0700, $0.0750
Support: $0.0600, $0.0550, $0.0500
Your capital is at risk
Hedera Hashbar Market Price Analysis: The Indicators’ Point of View
Due to the tug-of-war in the Hedera Hashgraph market, the upper and the lower bands of the Bollinger band began to converge between the 4th of October and the 10th of October. Buyers and sellers matched their strengths together; resulting in a flat market with no new direction (except for the fact that the market was already slightly in a bullish trend). But between yesterday and today, we see the market breaking out in a bullish way. The RSI line has now risen to 59.6% while the slower line of the RSI indicator is still at 46.9% (but responsive to the change in the market). The breakout was rapid and with such momentum, we expect more bullish performance in this market.
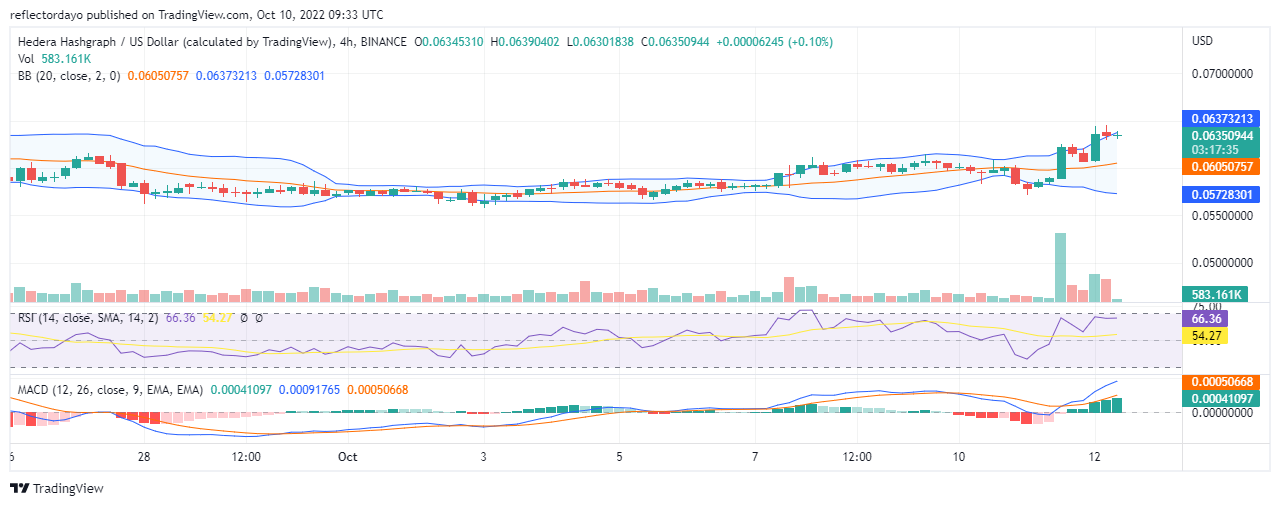
HBAR/USD 4-Hour Chart Outlook
In the first session, the market witnessed a very strong bullish candlestick pattern. But towards the end of that session, bears began to come into the market. The second session was a serious struggle between bears and bulls, but bulls minimized the damage in that session. The buyers are still showing signs of more strength. So, we can expect the price of the market to still rise.
Join Our Telegram channel to stay up to date on breaking news coverage