Join Our Telegram channel to stay up to date on breaking news coverage
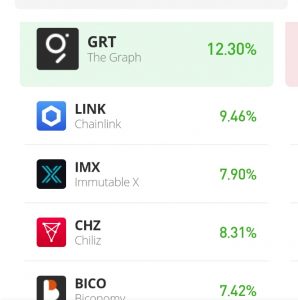
The Graph coin has put up some nice performance today, by moving 12.30% of its value upwards. The crypto took the place of Ethereum Name Service on the top spot of the crypto daily mover list. However, it is necessary to take a closer look at this crypto to see how well the crypto can perform from here on.
GRT price now: 0.1293
GRT Market Cap: 867.9 million
GRT Total Supply: 10 billion
GRT Rank: 57
Important Levels:
Resistance: $0.112, $0.120, $0.1293
Support: $0.108, $0.102, $0.090
GRT/USDT Value Prediction: The Graph Facing Exhaustion
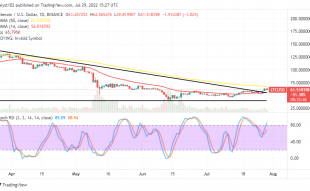
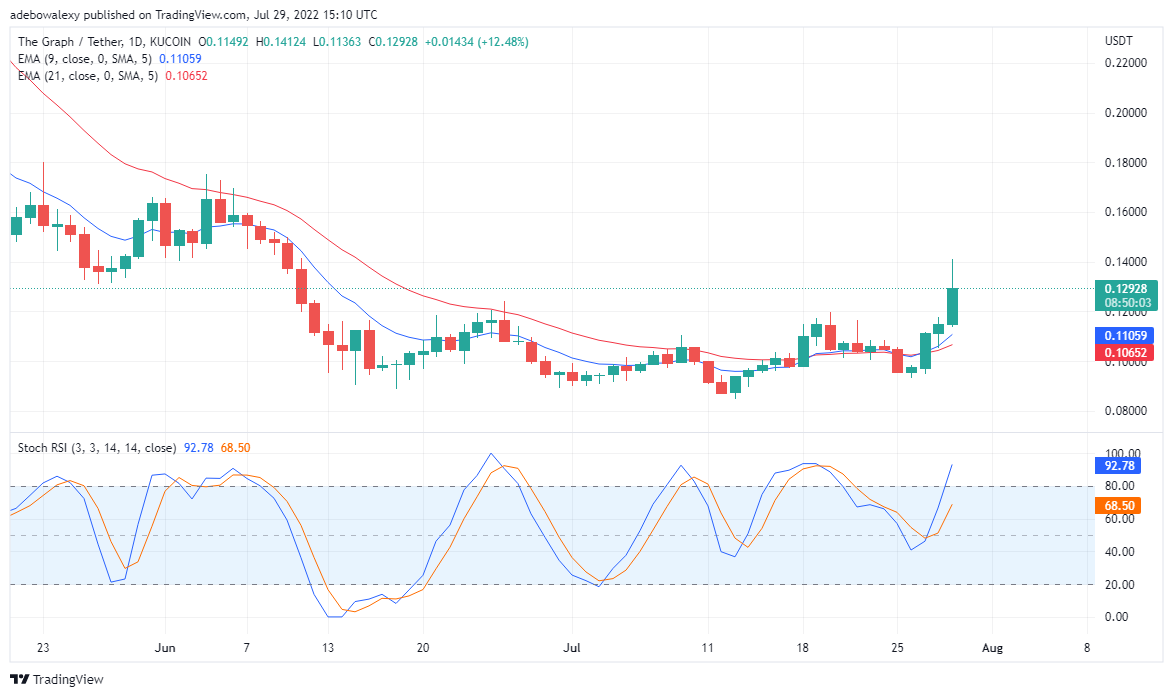
The daily chart for GRT/USDT shows that the uptrend is already exhausted. On this chart the, although the EMA lines stay under the price motion, the chances that this trend will soon reverse can’t be overruled. From the latest handle on this chart, we can observe that this candle has a long which above than below. Subsequently, this is showing us that it was a narrow win for the buyers. So, the next candlestick may not be so lucky as this one and may form a bullish one, eventually lowering the price.
Also, the Stochastic Relative Strength Indicator further confirms that this current trend will soon reverse. This can be seen from the curves of this indicator as it is already in the overseas sold region. Nevertheless, the price of The Graph may reach around $0.130 and $0.135 before it reverses.
GRT/USDT Value Prediction: More Vivid Signs of a Downward Correction
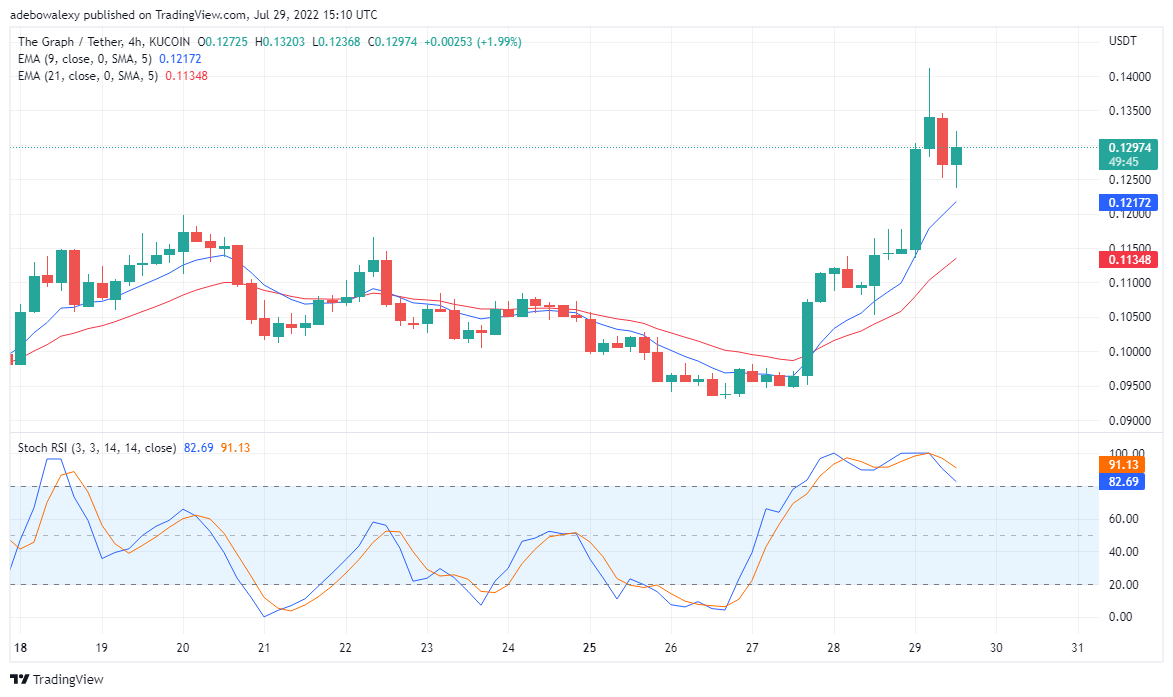
Looking at the GRT/USDT four-hour chart, a clearer revelation of what’s happening to this trend becomes clearer. The last three candles on this chart reveal that the reversal has begun. The second to the last candle on this chart was bullish, which brought the price lower. However, the next candle formed as a bullish one but wasn’t able to push the price up to half the length of the bullish candle.
Also, we can see the behavior of the EMA curves, as it is already touching the candle. Eventually, these lines will cross above the price motion. And, as long as the EMA lines stay above the price motion price will plummet. Buyers will then be needed to reverse the trend. Additionally, the Stochastic Relative Strength Indicator curve is already plunging downwards. Therefore, soon price of The Graph will fall to the resistance, perhaps at $0.120 and $0.100, as traders may be placing a short order soon.
Join Our Telegram channel to stay up to date on breaking news coverage