Join Our Telegram channel to stay up to date on breaking news coverage
GMX Price has recorded one of the most striking uptrends so far, soaring almost 92% year-to-date. The token is up 4% in the day, with a 24-hour trading volume of $86.2 million. Similarly, its market cap has also increased by almost 3% between Friday and Saturday to $627.4, securing its #76 on CoinMarketCap.
GMX Soars With The Launch Of The Pilot Version of GMX Powered by dAppOS
In a January 31 medium announcement, dAppOS said that it has collaborated with decentralized spot and perpetual exchange GMX to offer a seamless user experience (UX) courtesy of the dappOS Web3 operating protocol.
Exciting News🔥
The pilot version of @GMX_IO on @avalancheavax powered by #dappOS is going live👏
You'll be able to experience GMX seamlessly from your #BSC #Ethereum wallet
You're invited to be our first batch of users: https://t.co/rLcWgWF6bt
More👇https://t.co/16Ek0i9o50 pic.twitter.com/mhTbhOPqBx
— dappOS |V2 Live (@dappOS_com) January 31, 2023
The partnership is expected to eliminate, or at the very least, lower the entry barriers for users to access GMX’s decentralized finance (DeFi) functions on the Arbitrum and Avalanche blockchains. Speaking about the new product launch, Ecosystem Lead at dAppOS Darren Mayberry said:
GMX empowers users by letting them benefit from its low swap fees and zero price impact trades when leverage trading and market making through GLP. dappOS simplifies the procedures and makes DeFi intuitive, allowing users to access GMX seamlessly cross-chain. Together, we can realize the promise of Web3 for truly democratic decentralized finance.
The year 2023 has been good for the GMX token so far, and the fortune seems to have extended to the new month as GMX price hit a high of $81.3 into the weekend before losing some of the gains to the current price of $73.95. Still, this is the highest the token has ever reached since listing on Binance.
With the price continuing its new month uptrend, all signs indicate a growing interest in GMX tokens among investors.
GMX Price Confirms The Target Projected By An Inverse H&S Chart Pattern
On January 30, GMX price was trading in an inverse head-and-shoulders (H4S) chart pattern as bulls set their eyes on the $73 level, which would mark another milestone for the token since listing. The technical formation came as buyers strived to achieve a bullish breakout that would see the token end the first month of the year with a record of accomplishment. As it happened, the GMX price closed above the inverse H&S’s neckline, confirming the target.
At the time of writing, GMX was trading at $74.37 after gaining 2.46% on the last day. The price came as bulls built upon the gains made on Friday. With this price, the DEX token has made good on the prediction mentioned above, as shown in the chart below (target attained).
The token was confronting immediate resistance at $80 after an intraday high of $77.88. An increase in buying pressure above the 78.6% Fibonacci retracement at $75.79 could provide the required momentum for more gains.
With such a breakout, the next realistic target for GMX price would be to tag the 100% Fibonacci retracement at $81.3. Note that the token tagged this level on Friday’s high but was rejected, possibly because bulls needed more charge. If they achieve that in the day’s trading session, it would set the tone for more gains, with all signs pointing to the 123.6% Fibonacci retracement at $87.38 and, in highly ambitious cases, the 150% Fibonacci retracement at $94.19.
GMX/USD Daily Chart
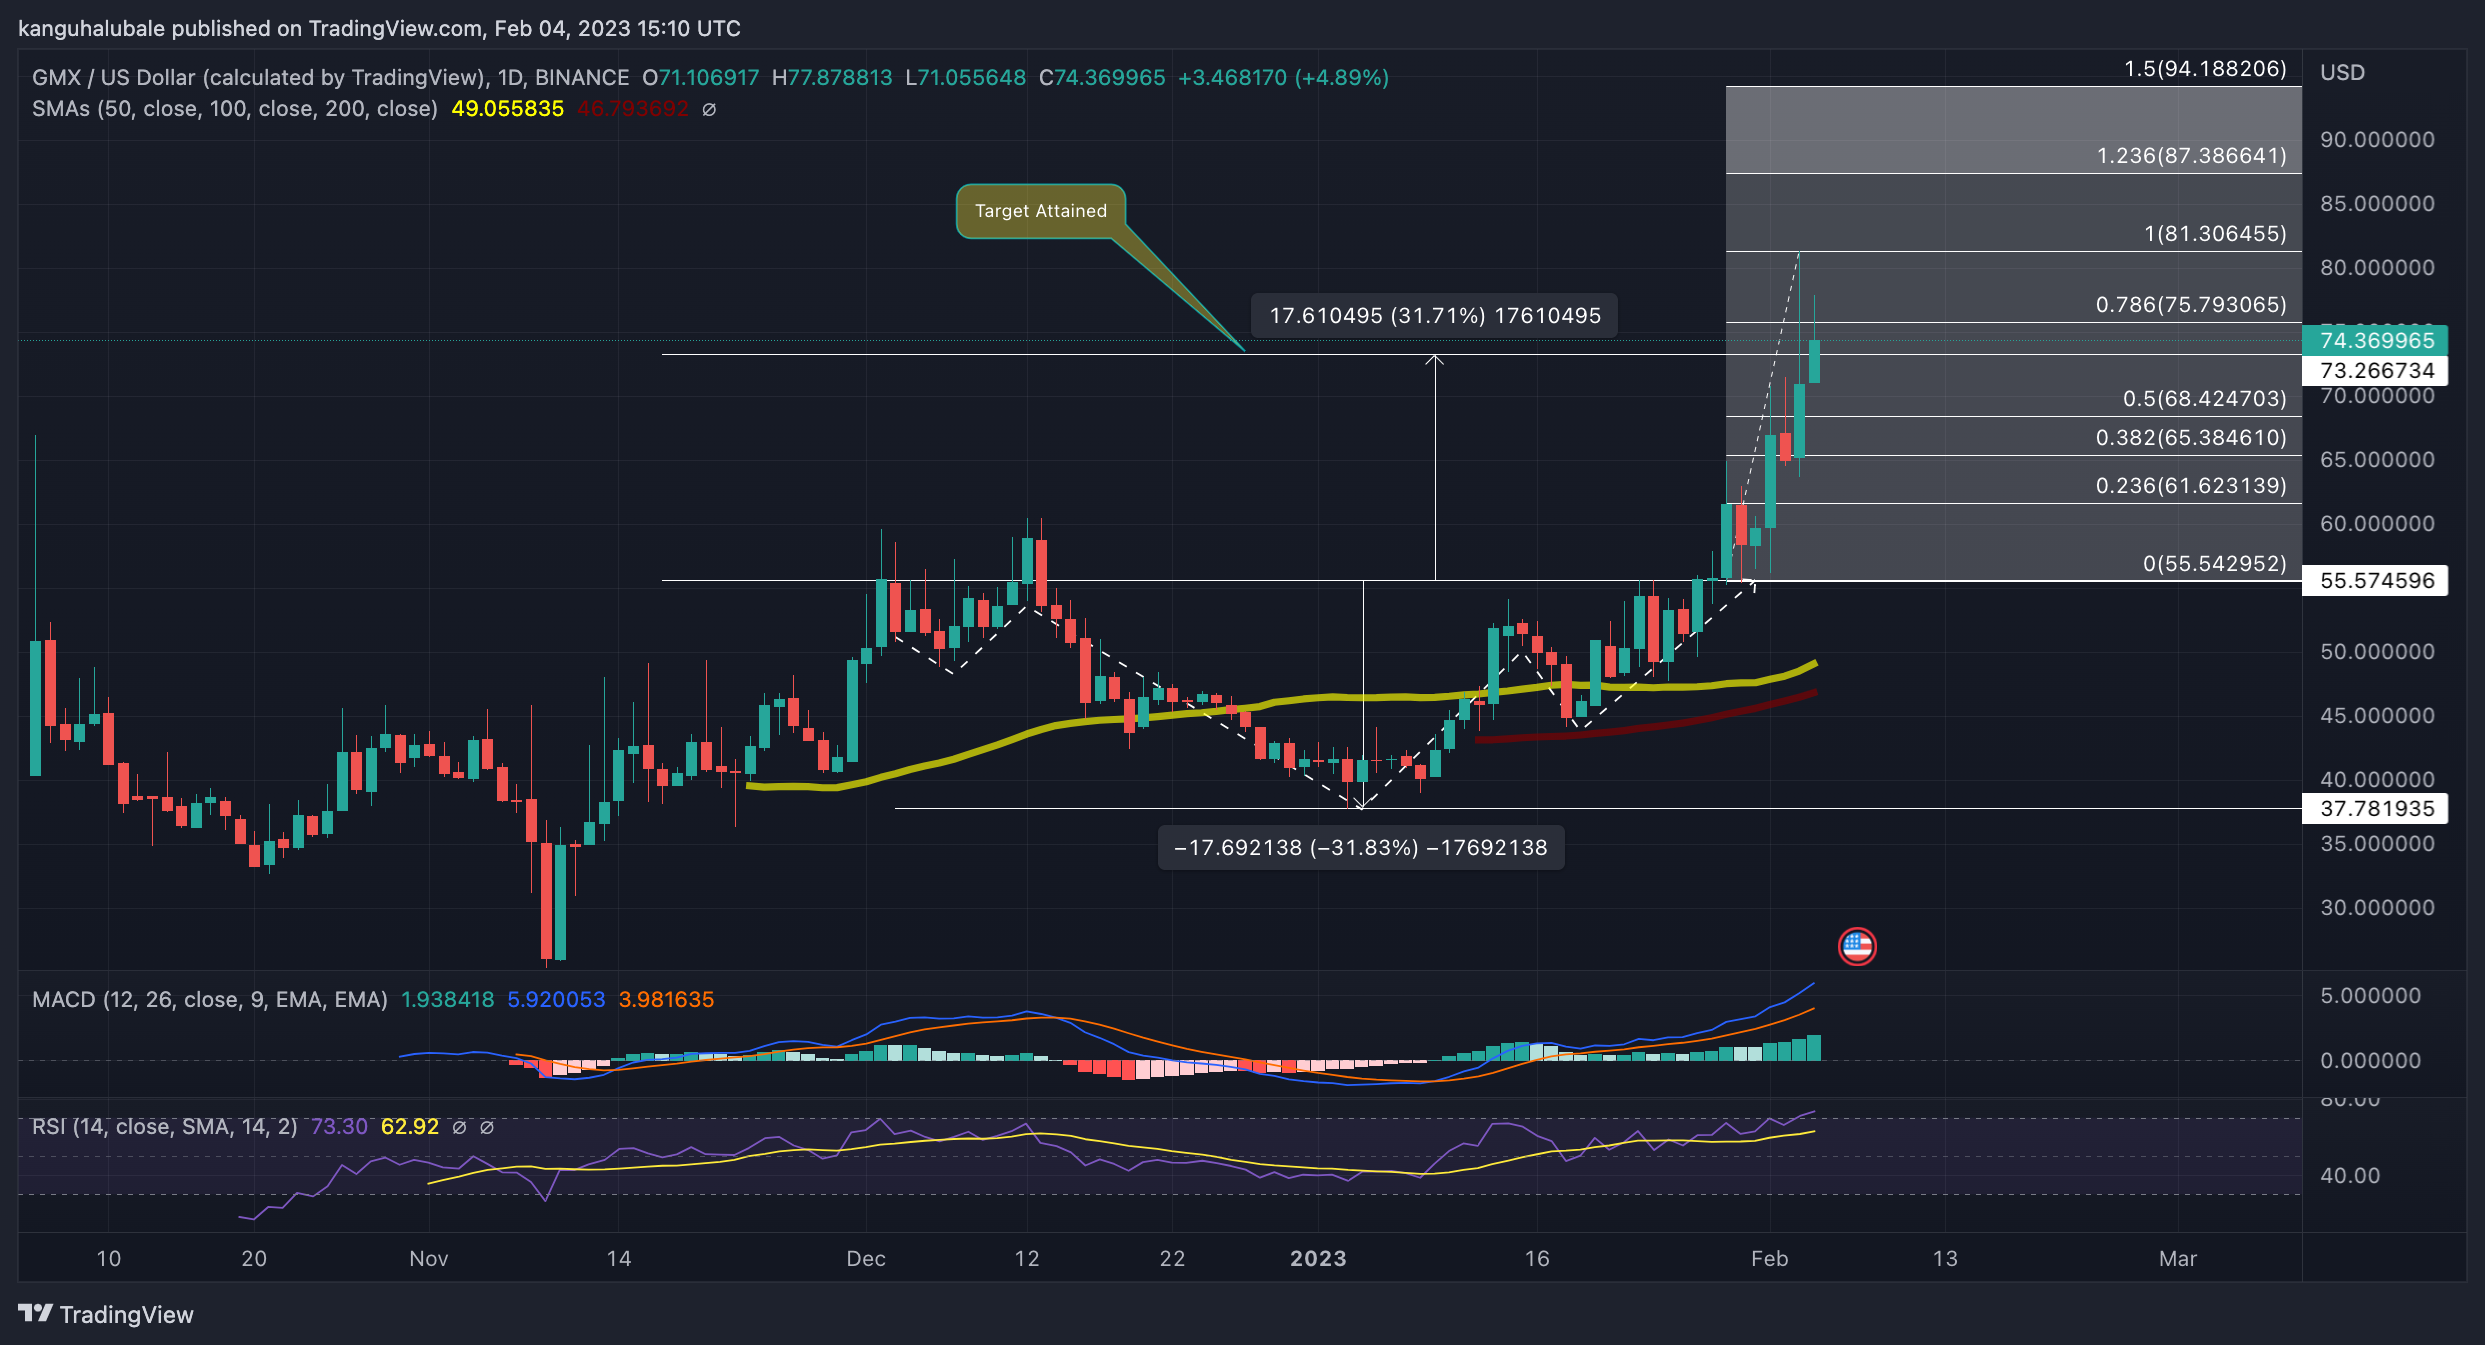
The bullish outlook remains solid for GMX price as supported by the upward movement of the 50-day Simple Moving Average (SMA), the Relative Strength Index (RSI), and the Moving Average Convergence Divergence (MACD), showing that the market favored the upside.
Nevertheless, with such a watershed moment for bulls, some investors may see this as the right time to book profits, sparking a selling spree that could threaten the expected gains. In such a scenario, the GMX price could lose its current support at $73.27, exposing it to a cliff.
Logically, the first platform the price would step on would be the 50% Fibonacci retracement at $68.42, or down to revisit Friday’s bottom embraced by the 38.2% Fibonacci retracement at $65.38. Such an outcome could spook the remaining chunk of investors to also sell, causing GMX price to drop towards the 23.6% Fibonacci retracement at $61.62 or the inverse H&S neckline at $55.54.
Below that, the only base standing between the GMX price and the $37.78 support floor would be the 50-day and 100-day SMAs at $49.06 and $46.79, respectively. Notice that the RSI at 73 had just entered the overbought region, which could hint at a possible market correction in the near term.
GMX Alternative
With the outlook looking ‘too good to be true’ for GMX price, spread your risk by investing in Meta Masters Guild’s native token MEMAG.
MEMAG is still in the presale stage, where they have raised over $2.71 million so far. With analysts predicting an impressive 2023 for the token, this would be an excellent time to buy while the token is still affordable.
Read More:
- dYdX Price Prediction As DYDX Bulls Fight Off A Supplier Congestion Zone
- MAGIC Price Looks Strong Below $2, Can It Tag $2.5?
- Another SBF Company Goes Under – Are You Affected?
Join Our Telegram channel to stay up to date on breaking news coverage