


Join Our Telegram channel to stay up to date on breaking news coverage
GBPJPY Price Analysis – June 19
The market opened today with a bullish candle on the daily chart, the price is moving towards $139 level. Increase in the Bulls’ pressure may lead to a further increase in the GBPJPY price that may reach $139 level.
GBP/JPY Market
Key levels:
Supply levels: $138, $141, $143
Demand levels: $135, $130, $127
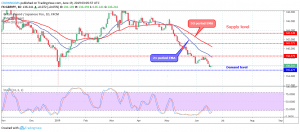
GBPJPY Long-term trend: Bearish
On the long-term outlook, GBPJPY is bearish. The pullback that happened on June 03 to retest the broken level of $138 could not go beyond the level. The price was resisted at the mark. A bearish reversal candle pattern formed called Tweezer top; this pattern triggered the resumption of bearish movement towards $135 demand level. The Bearish pressure increased and the mark was reached.

The Bearish pressure is getting weak as the bearish candle that placed the price at $135 level has turned to hammer on June 18; there is a tendency for the price to reverse at the demand level of $135. However, GBPJPY retains its trading below 21 periods EMA and 50 periods EMA, with an increase in the distance between the price and the EMAs which is a sign of the increase in the Bears’ momentum. The Stochastic Oscillator period 14 is below zero levels and its signal lines pointing up to indicate a buy signal.
GBPJPY medium-term Trend: Bearish
On the medium-term outlook, GBPJPY is bearish. The pair was bullish last week on the 4-hour chart. When the price reached the supply level of $138, the bullish strength was exhausted and the price observed a short consolidation at the mark. On June 12, the Bears resumed their bearish movement and the price descended to the demand level of $135. The bullish engulfing candle formed at the level indicates price reversal pattern.
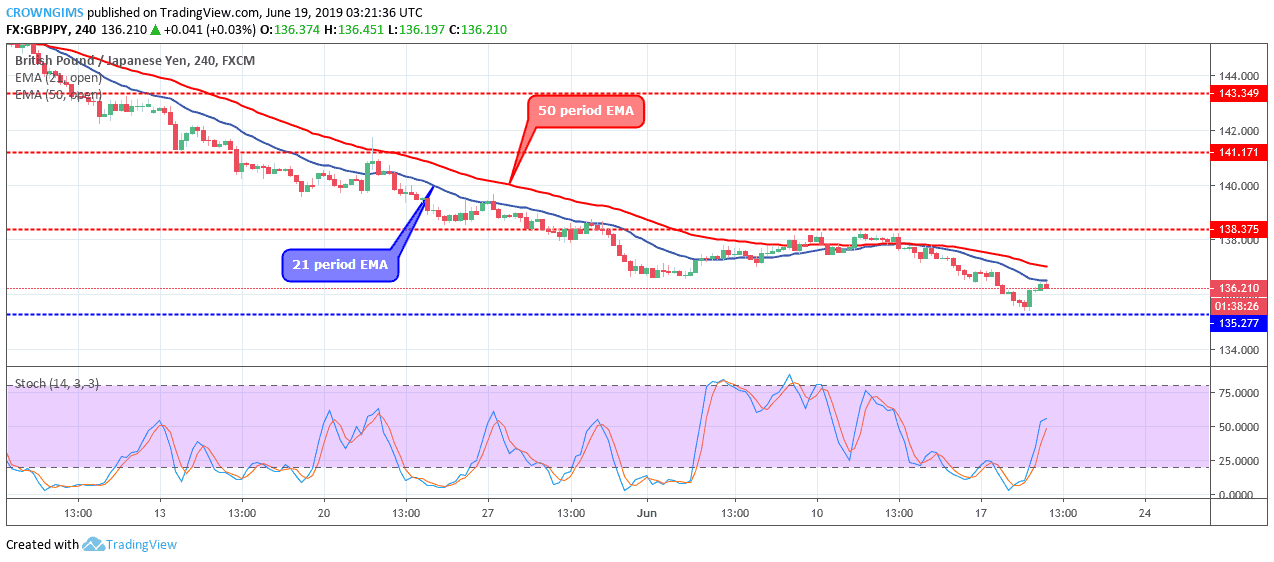
Meanwhile, the Stochastic Oscillator period 14 is at 50 levels and the signal lines pointing upward to indicate a buy signal.
Please note: insidebitcoins.com is not a financial advisor. Do your own research before investing your funds in any financial asset or presented product or event. We are not responsible for your investing results.
Join Our Telegram channel to stay up to date on breaking news coverage
