Join Our Telegram channel to stay up to date on breaking news coverage
GBPJPY Price Analysis – July 16
In case the Bears continue with their strong bearish momentum, the price may fall to the low demand level of $130. The pullback is inevitable as the price is descending, should the Bulls interrupt the bullish movement, the price may consolidate.
GBP/JPY Market
Key levels:
Supply levels: $135, $138, $141
Demand levels: $130, $127, $123
GBPJPY Long-term trend: Bearish
On the long-term outlook, GBPJPY is bearish. The GBPJPY was consolidating last week at $135 level. On July 15, a bearish candle emerged that break down the former demand level of $135 level. Following this scenario is the formation of a bearish candle that pushes down the GBPJPY further. The demand level of $130 is currently exposed to the pair.
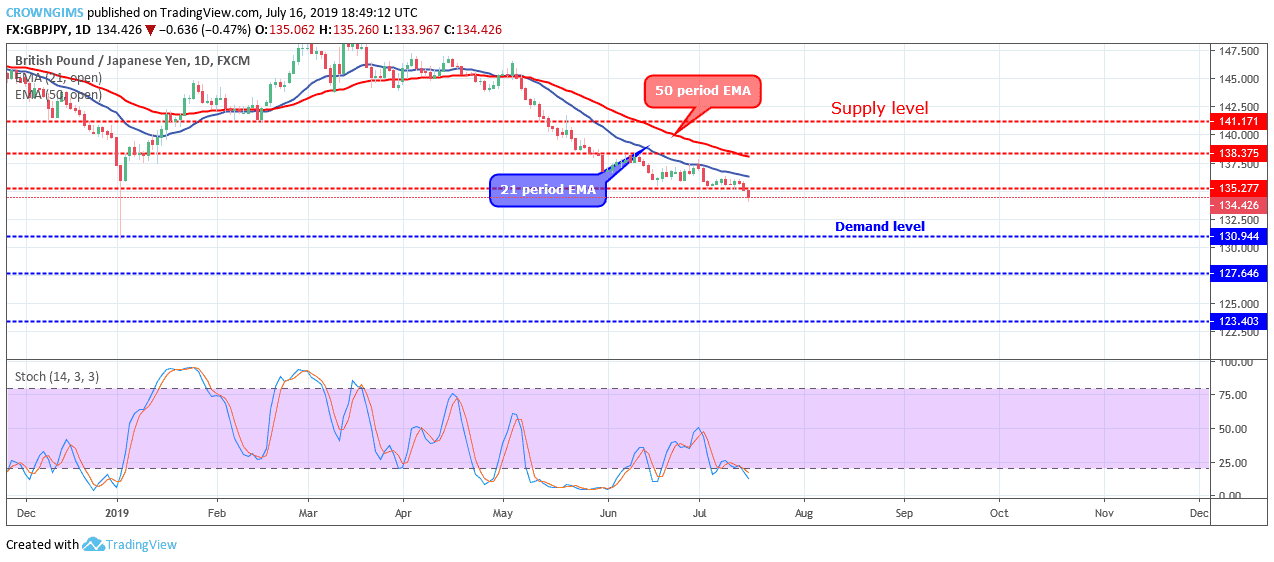
In case the Bears continue with their strong bearish momentum, the price may fall to the low demand level of $130. The pullback is inevitable as the price is descending, should the Bulls interrupt the bullish movement, the price may consolidate. GBPJPY is trading below the 21 periods EMA and 50 periods EMA. The Stochastic Oscillator period 14 is at 20 levels and the signal lines pointing down to indicate a sell signal.
GBPJPY medium-term Trend: Bearish
GBPJPY is bearish on the medium-term outlook. The Bearish momentum broke down the $135 demand level on July 15. Price retracement was carried out towards the broken level. The Bears pushed down the price towards the $130 level.
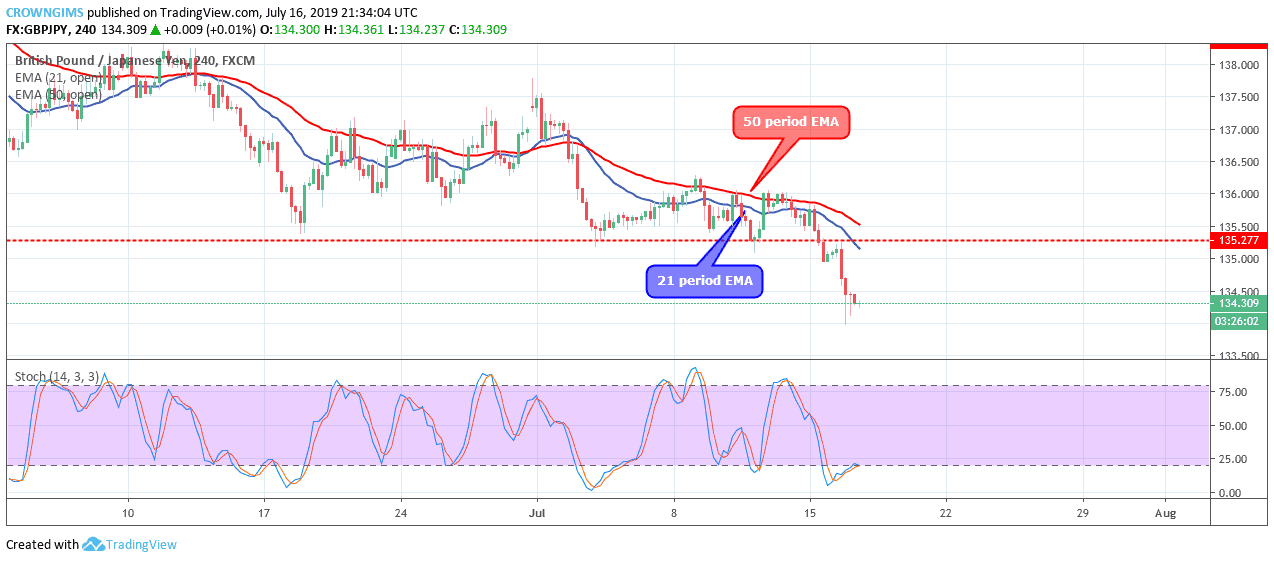
The currency pair is trading below the 21 periods EMA and 50 periods EMA currently. The Stochastic Oscillator period 14 is at 20 levels and the signal lines pointing down to indicate a sell signal.
Please note: insidebitcoins.com is not a financial advisor. Do your research before investing your funds in any financial asset or presented product or event. We are not responsible for your investing results.
Join Our Telegram channel to stay up to date on breaking news coverage