Join Our Telegram channel to stay up to date on breaking news coverage
ETH Price Analysis – July 16
Since last month, the Ethereum markets have been down. However, high volatility should help restore the uptrend. Otherwise, ETH would remain in its current downtrend.
ETH/USD Market
Key Levels:
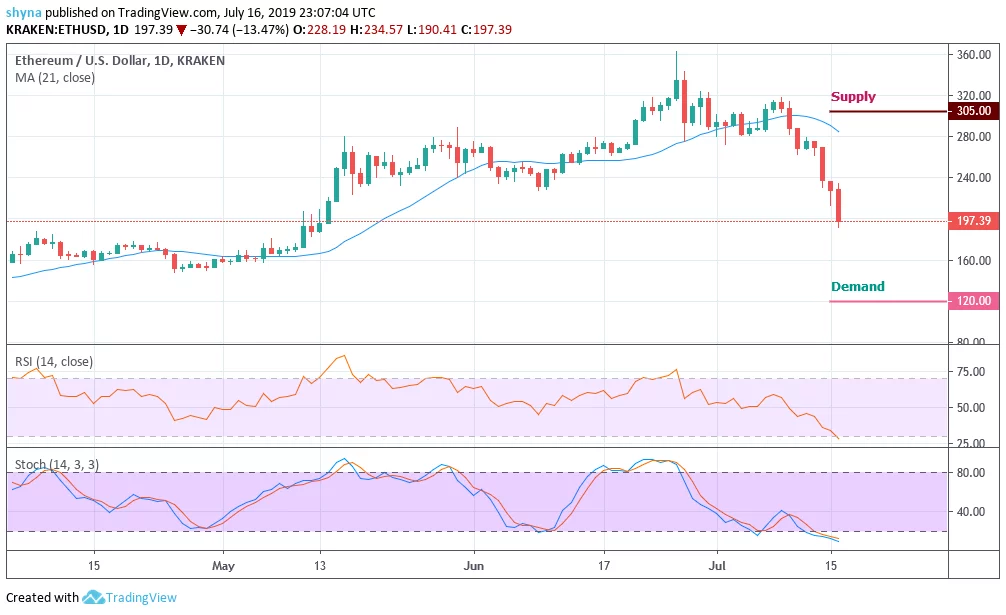
Resistance levels: $305, $310, $315
Support levels: $120, $115, $110
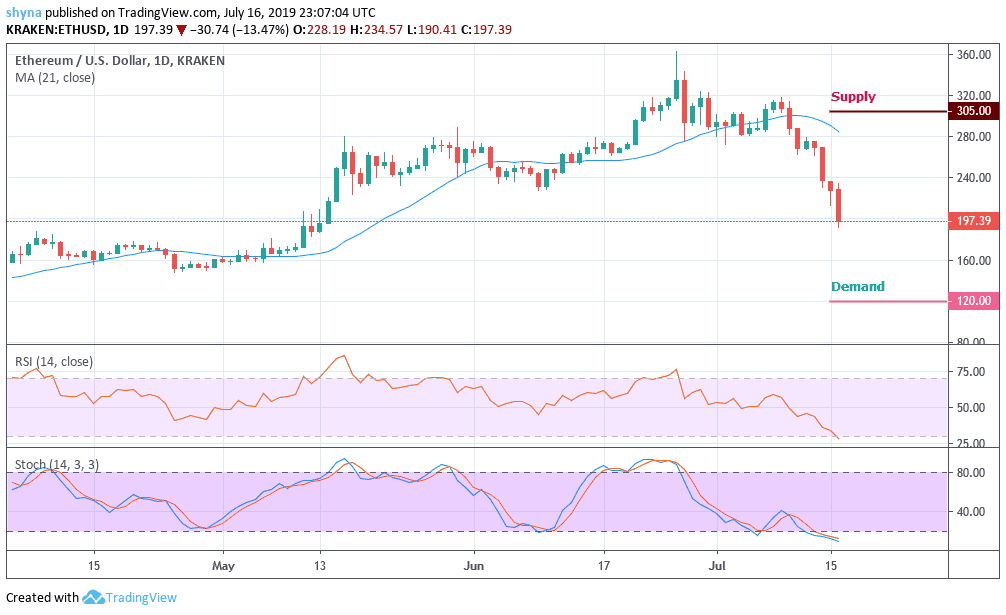
Ethereum failed to find support at $200, as seen in the daily chart. The price brought declines to $190. With a loss of over 13%, ETH/USD is changing hands at $197. The prevailing trend is strongly bearish. However, it is essential that the bulls push the price above $200 to avoid further declines.
In addition, the Ethereum bears managed to push the price well below the critical level of $200 below the 21-day moving average. To follow both the RSI and MACD signals, a possible decline could meet demand at $120, $115 and $110. On the other hand, a sustained recovery above $270 could push the coin up to $305, resistance levels of $310 and $315 are needed to ease the immediate downward pressure.
ETH/BTC Market
Against BTC, the support around 0.025BTC failed and the price tested the range at 0.02BTC but the RSI and THE stochastic RSI indicators show that there is a chance to break down to 0.017BTC. That’s not a positive sign from a technical point of view. Resistance in this range is at 0.026BTC and beyond.
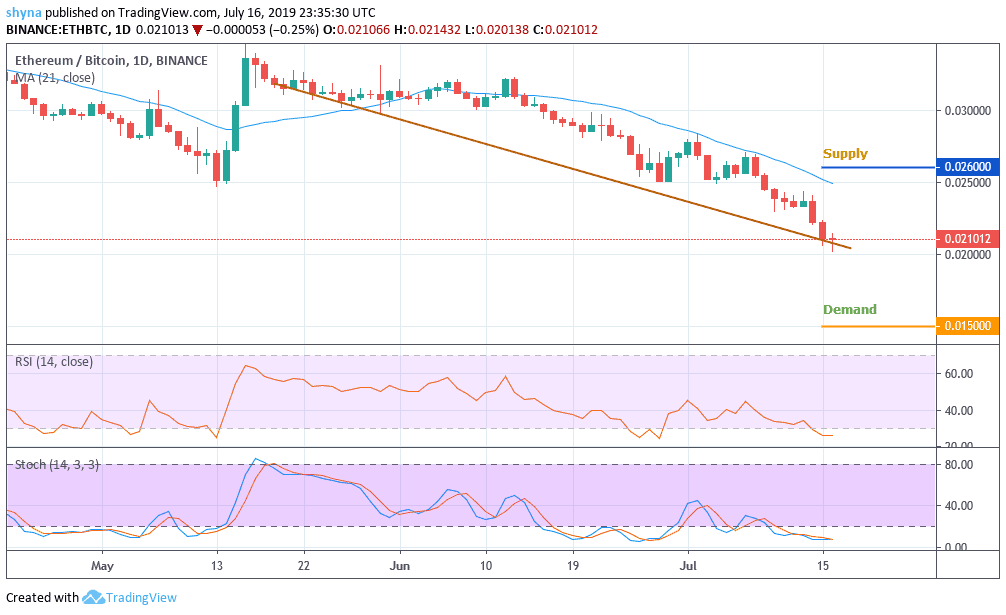
However, should in case the Ethereum price decides to move in an upward movement, it would quickly touch 0.026BTC resistance level. Similarly, a downward movement is likely to bottom at 0.015BTC and below.
Please note: insidebitcoins.com is not a financial advisor. Do your own research before investing your funds in any financial asset or presented product or event. We are not responsible for your investing results.
Join Our Telegram channel to stay up to date on breaking news coverage