
Join Our Telegram channel to stay up to date on breaking news coverage
GBPJPY Price Analysis – May 21
Should the Bulls push the price above $141 level and the daily candle close above the level, then, the price may move up further and make $143 level as its target. In case the Bears defend the $141 level bearish trend may continue.
GBP/JPY Market
Key levels:
Supply levels: $141, $143, $145, $146
Demand levels: $139, $137, $134
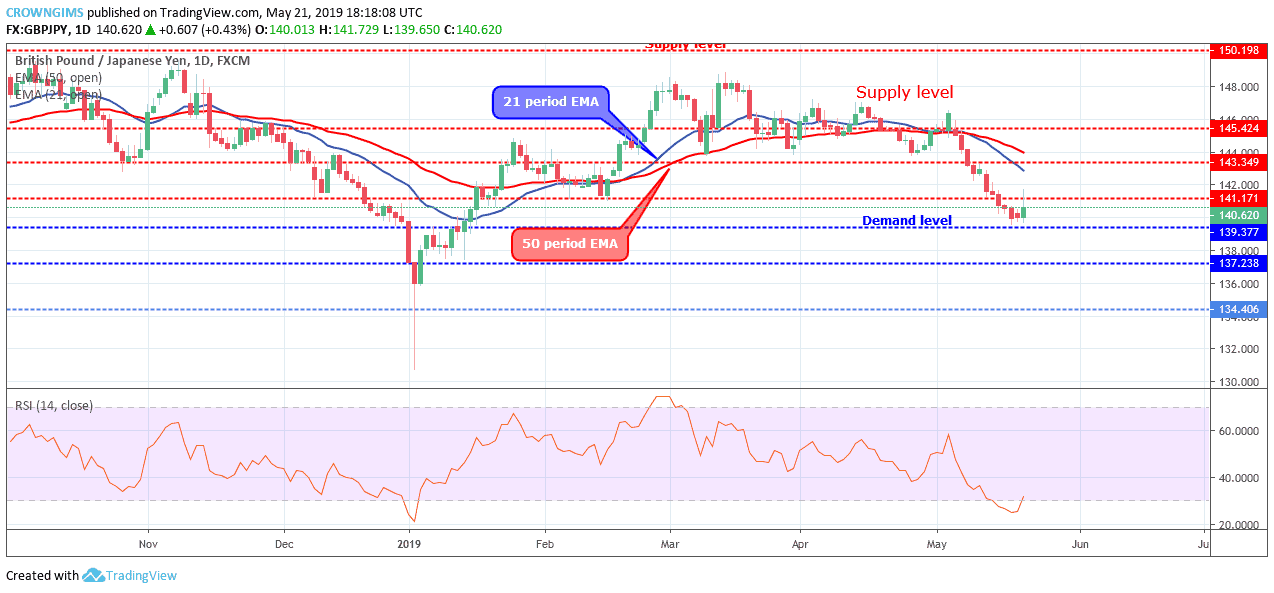
GBPJPY Long-term trend: Bearish
The bearish movement continues in the GBPJPY market. GBPJPY has been strongly bearish for more than two weeks. Last week was not exempted, the Bears maintained their pressure and the barrier at $141 level was penetrated, the GBPJPY price decreased to $139 level which is our last week predicted the target. Today, a strong daily bullish candle formed at the demand level of $139, which may be a sign of trend reversal.
The GBPJPY currency pair remains trading below 21 periods EMA and 50 periods EMA and the pair is moving farther away from the EMAs which indicate the strong bearish pressure in the GBPJPY market. The Relative Strength Index period 14 is at 20 levels with the signal lines bending up to indicate a buy signal.

Should the Bulls push the price above $141 level and the daily candle close above the level, then, the price may move up further and make $143 level as its target. In case the Bears defend the $141 level bearish trend may continue.
GBPJPY medium-term Trend: Bearish
GBPJPY is under the strong bearish momentum in the medium-term outlook. The Bearish momentum increased and the price decreased to bottom at the low of $139 demand level. The Bulls were reacting against the price declination and that is why a 4-hour bullish candle emerged at the $139 level and the price pulled back to $141.
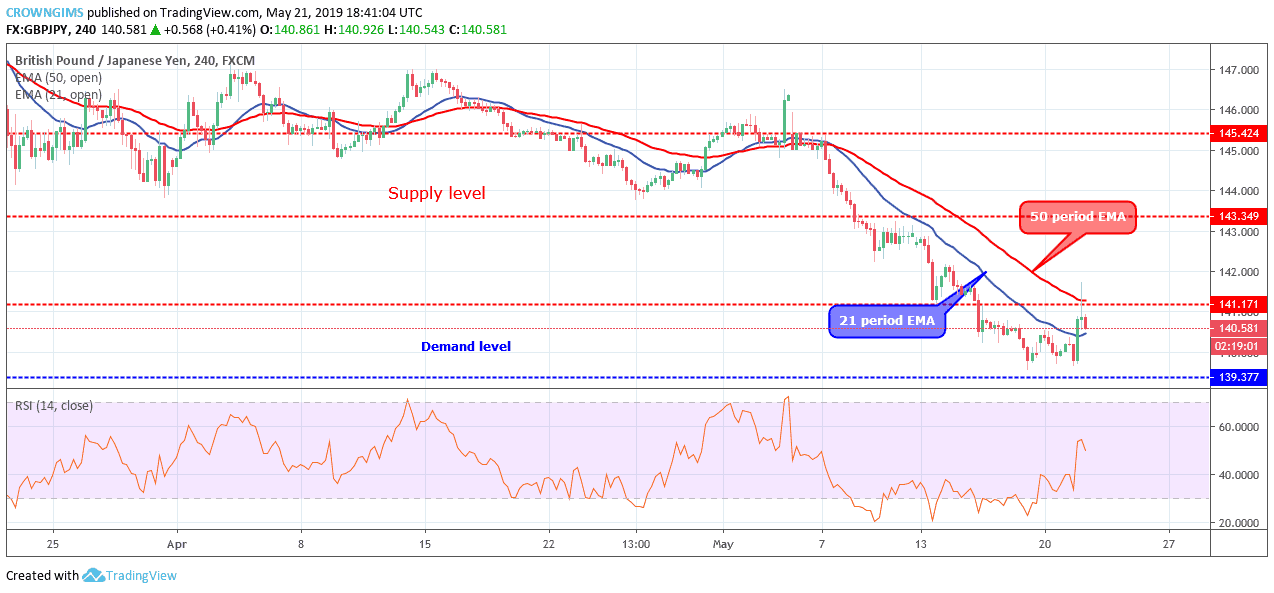
The Relative Strength Index period 14 is below 60 levels with the signal lines pointing down to indicate sell signal.
Please note: insidebitcoins.com is not a financial advisor. Do your own research before investing your funds in any financial asset or presented product or event. We are not responsible for your investing results.
Join Our Telegram channel to stay up to date on breaking news coverage