

Join Our Telegram channel to stay up to date on breaking news coverage
BCOUSD Price Analysis – May 26
The price started consolidating at $70 level, on May 20, the weekly candle was bearish and this broke down the $70 level and the weekly bearish candle closed below the $70 level last week. This indicates that the bearish trend may continue towards $64 level.
BCO/USD Market
Key levels:
Supply levels: $70, $79, $87
Demand levels: $64, $58, $49
BCOUSD Long-term trend: Ranging
On the long-term outlook, Brent Crude Oil is ranging. The Bullish momentum pushed the price up towards the $79 level at the early part of the week on April 22. The Bears rejected the upward movement and the price dropped, thus, led to the changing of the weekly bullish candle to bearish inverted hammer. The price started consolidating at $70 level, on May 20, the weekly candle was bearish and this broke down the $70 level and the weekly bearish candle closed below the $70 level last week. This indicates that the bearish trend may continue towards $64 level.
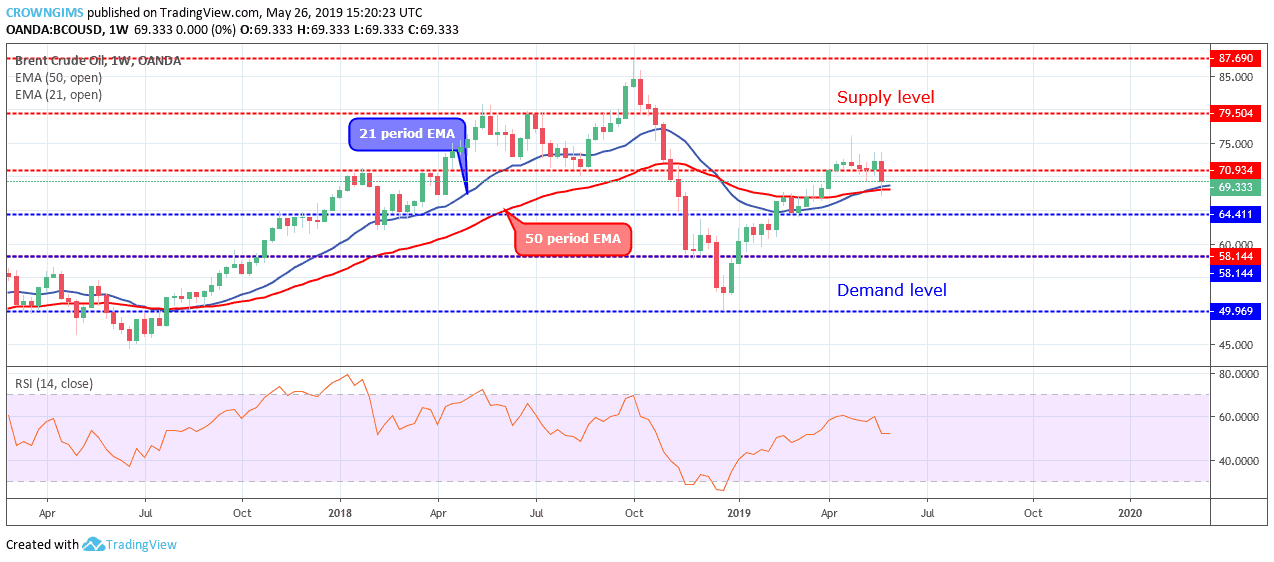
The commodity is directly placed on the 21 periods EMA and the 50 periods EMA. The Relative Strength Index period 14 is at 50 levels and the signal lines bending down to indicate sell signal.
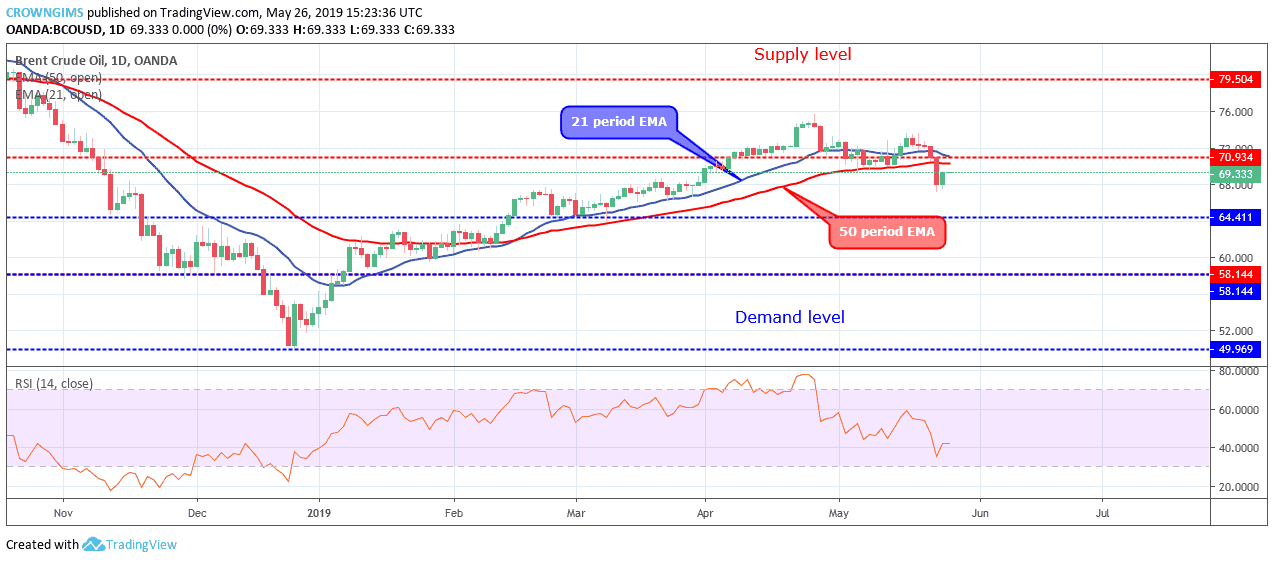
BCOUSD medium-term Trend: Bearish
On the daily chart, Brent Crude Oil is on the bearish movement. Brent crude oil was ranging on the daily chart last week at $70 level. On May 23, the Bears increased their momentum and the former demand level of $70 level gave in and the price decreased towards $64 level. There was a price pullback the following day; thus the market closed with a daily bullish candle.

The Brent Crude Oil is currently trading below the 21 periods EMA and 50 periods EMA. The Relative Strength Index period 14 is at 40 levels with the signal lines pointing up to indicate buy signal in which it may be a pullback.
Please note: insidebitcoins.com is not a financial advisor. Do your own research before investing your funds in any financial asset or presented product or event. We are not responsible for your investing results.
Join Our Telegram channel to stay up to date on breaking news coverage
