Join Our Telegram channel to stay up to date on breaking news coverage
The Fetch.ai price prediction shows that FET spikes above the 9-day and 21-day moving averages to touch the $0.47 high.
Fetch.ai (FET) Prediction Statistics Data:
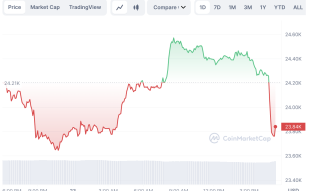
- FET price now – $0.44
- FET market cap – $364.4 million
- FET circulating supply – 818.9 million
- FET total supply – 1.1 million
- FET Coinmarketcap ranking – #122
FET/USD Long-term Trend: Bullish (1D Chart)
Key Levels:
Resistance levels: $0.60, $0.65, $0.70
Support levels: $0.30, $0.25, $0.20
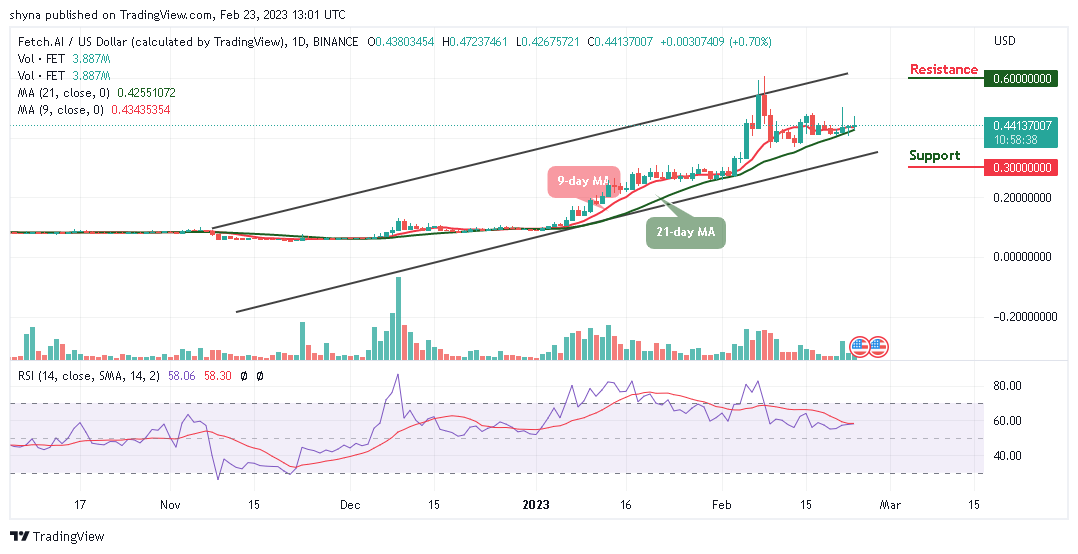
FET/USD is breaking to the positive side as the coin is posting gains of over 0.70% in the last 24 hours, with the coin trading above the 9-day and 21-day moving averages at $0.44, the coin may head towards the upper boundary of the channel.
Fetch.ai Price Prediction: FET Price Explodes to the Upside
The Fetch.ai price is facing the upside as the coin heads toward the upper boundary of the channel. However, if the market continues the upward movement, the $0.50 resistance level is likely to surface. Therefore, FET/USD may further look for higher price levels if the bulls continue to show commitment.
At the time of writing, the market is displaying a sign of subduing volatility within the channel and if the coin decides to resume back under the control of bears, the price could locate the supports at $0.30, $0.25, and $0.20. However, the Relative Strength Index (14) is likely to cross above the 60-level as the next resistance levels could be found at $0.60, $0.65, and $0.70 respectively.
Against Bitcoin, the Ethereum price is planning to stay above the 9-day and 21-day moving averages. It is currently heading towards the upper boundary of the channel, targeting the nearest resistance level of 2000 SAT. Moreover, moving near the upper boundary of the channel could touch the resistance level at 2500 SAT and above.
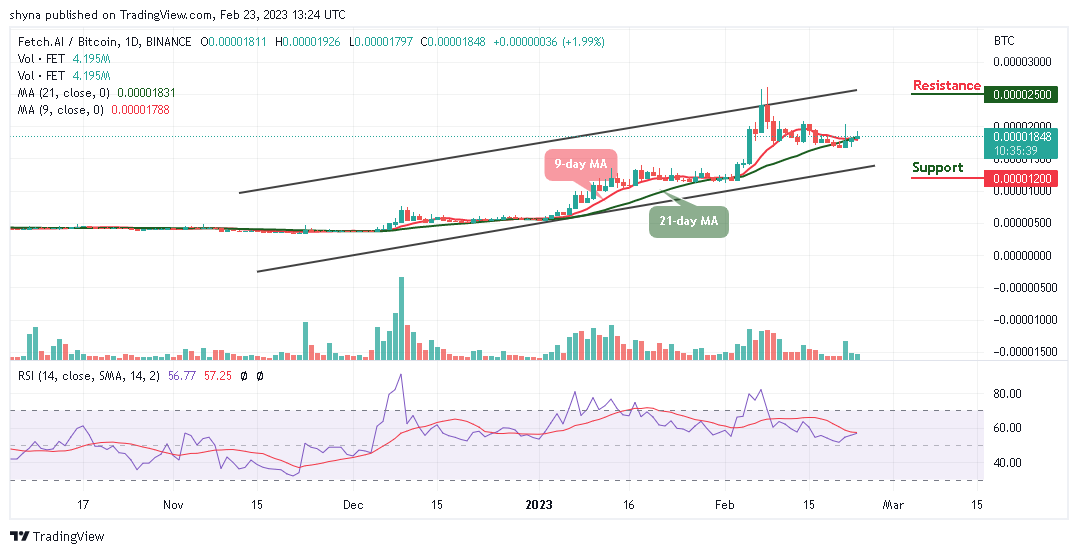
In the other words, any negative movement by the sellers to send the coin below the 9-day and 21-day moving averages may locate the support level at 1500 SAT and below. Meanwhile, the technical indicator Relative Strength Index (14) is moving within the overbought region which could increase the bullish movement within the channel.
Fetch.ai Alternatives
According to the daily chart, the Fetch.ai price is yet to cross above the upper boundary of the channel. Instead, the bears are trying to force their way back to the downside but any further bullish movement above the resistance level of $0.60 could increase the buying pressure for the coin. On that note, here is a coin that is doing great in the presale – Fight Out aims to reach hundreds of millions of everyday people who engage in both formal and casual workout routines. The project’s philosophy is to create workout routines, especially for particular sports and activities. Its presale has now raised almost $5 million as this could be the best time to invest.
Join Our Telegram channel to stay up to date on breaking news coverage