Join Our Telegram channel to stay up to date on breaking news coverage
The Fetch.ai price prediction shows that FET could spike a significant surge if the price breaks above the upper boundary of the channel.
Fetch.ai Prediction Statistics Data:
- Fetch.ai price now – $0.31
- Fetch.ai market cap – $261.2 million
- Fetch.ai circulating supply – 818.9 million
- Fetch.ai total supply – 1.1 billion
- Fetch.ai Coinmarketcap ranking – #138
FET/USD Market
Key Levels:
Resistance levels: $0.40, $0.45, $0.50
Support levels: $0.20, $0.15, $0.10

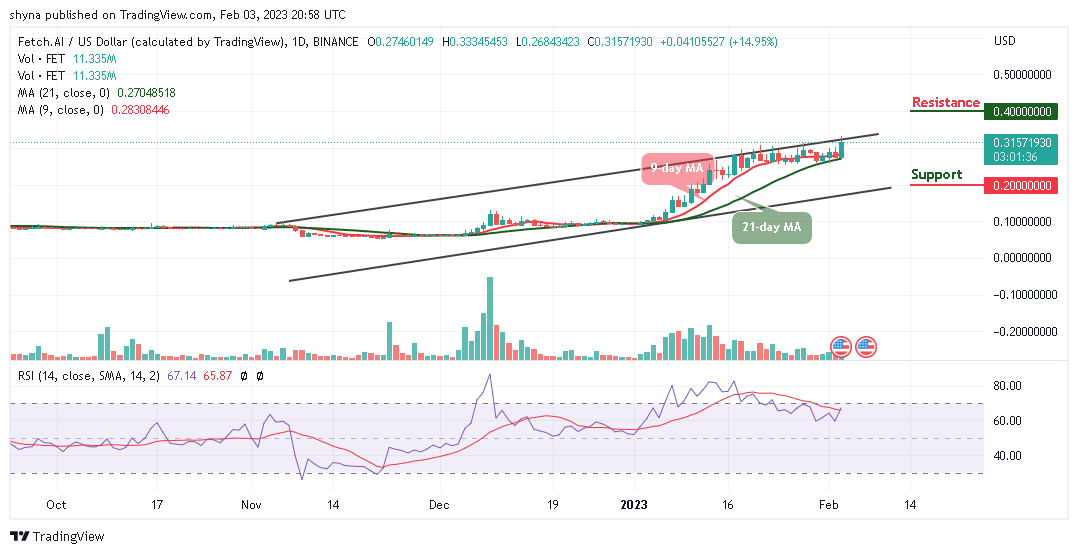
FET/USD is beginning to create a new bullish movement as the coin crosses above the 9-day and 21-day moving averages to touch the daily high at $0.33 and also preparing a bullish cross above the upper boundary of the channel. However, the Fetch.ai price is likely to create additional upward as the bulls could dominate the market.
Fetch.ai Price Prediction: Fetch.ai (FET) Could Trigger Fresh Rally
The Fetch.ai price can only increase the bullish movement if the coin crosses above the upper boundary of the channel. At the time of writing, the technical indicator Relative Strength Index (14) is moving to cross above into the overbought region to encourage more buyers to enter the market.
Nonetheless, as the 9-day moving average remains above the 21-day moving average, FET/USD may continue with the bullish movement, if not, the market price could hit the support levels at $0.20, $0.15, and $0.10 once the bears return into the market. However, if the technical indicator makes a cross into the overbought region, then, there may be a quick bullish rise which could push the market to the resistance levels of $0.40, $0.45, and $0.50 respectively.
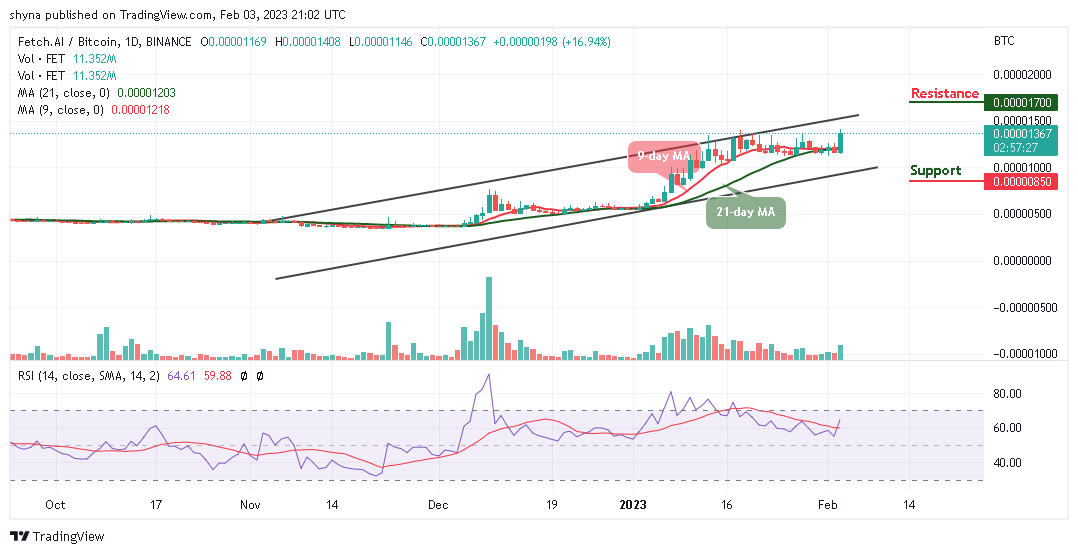
Again Bitcoin, the Fetch.ai price is now hovering at 1367 SAT as the coin spikes above the 9-day and 21-day moving averages. Meanwhile, the technical indicator Relative Strength Index (14) is seen moving above the 60-level. However, for the fact that the market keeps ranging, the coin is likely to move toward the upper boundary of the channel.

Moreover, the daily chart reveals that the potential resistance level could be located at 1700 SAT and above, but any bearish movement below the lower boundary of the channel may attract new sellers to come into the market with the next focus on the support level of 850 SAT and below.
Fetch.ai Alternatives
After touching the daily high at the $0.33 level, the Fetch.ai bulls are likely to keep the coin on the positive side. However, FET is facing a crucial make-or-break moment in the daily chart, which could decide the long-term trend of the coin. Similarly, another coin that doing well in the market is Meta Masters Guild (MEMAG), and its presale has now raised almost $2.7 million as the demand for Play-to-Earn Gaming Surges and that could be the best time to buy.
Join Our Telegram channel to stay up to date on breaking news coverage


