Join Our Telegram channel to stay up to date on breaking news coverage
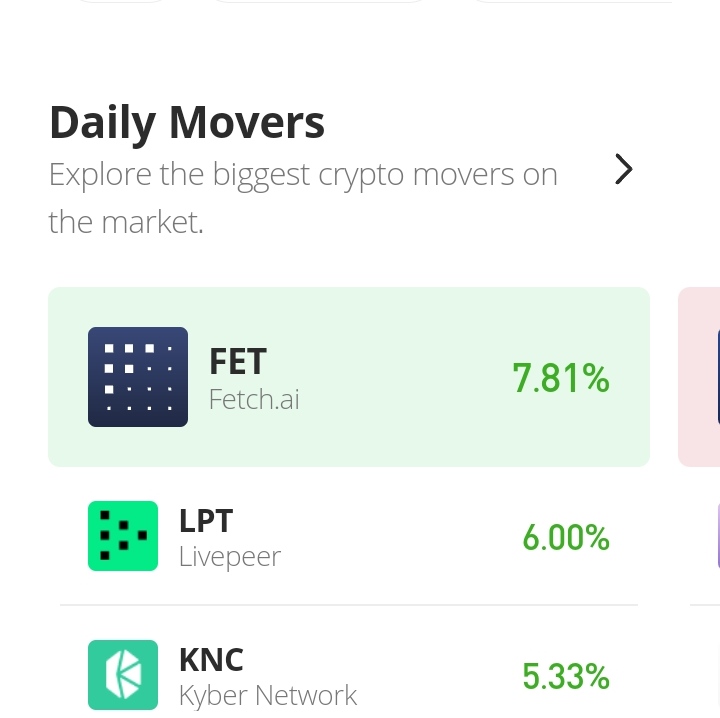
FET/USD on the chart is characterized by a trend of Indecision between the buyers and the sellers. One candlestick is not enough to confirm a trend. To confirm a trend, we need the same candle to reoccur severally to confirm the trend. The 4 price doji is a candlestick which has its open, close, high and low equal to the same value. This type of candle means the highest level of indecision on the part of buyers and sellers. The Fetch.ai trend has been filled with this 4-price doji since June. However, at some points, we see some strong price push and pull in the market. But they are not as much as the 4 price dojis in the market. However, In the past few days, we have seen some impressive bullish price performance and they have taken the price to $0.10074
Fetch.ai Market Price Statistic:
- FET/USD price now: $0.10074
- FET/USD market cap: $73,951,439
- FET/USD circulating supply: 746,113,681
- FET/USD total supply: 1,151,441,226
- FET/USD coin market ranking: #305
Key Levels
- Resistance: $0.10500 $0.11000 $0.12000
- Support: $0.0900, $0.0800 $0.07862
Your capital is at risk
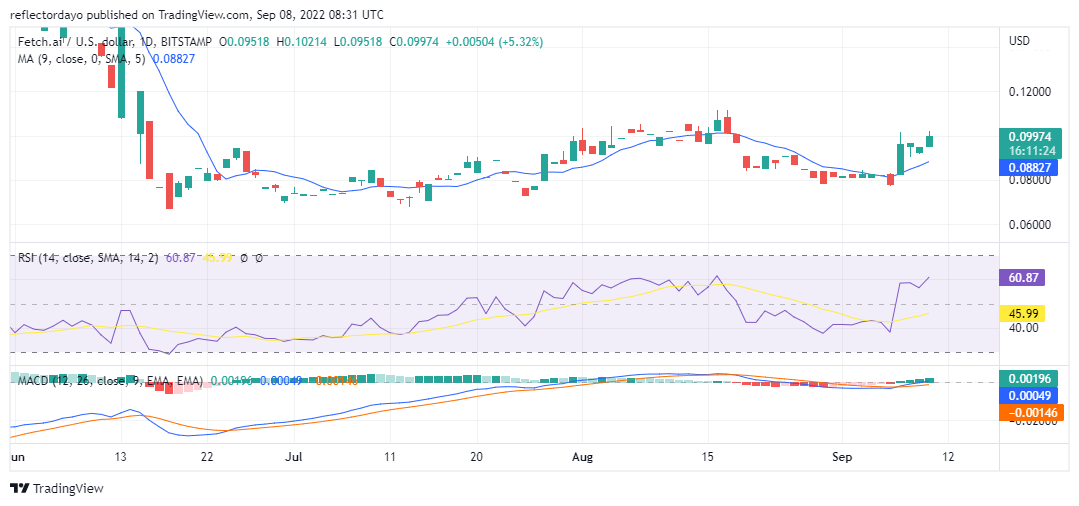
Fetch.ai Market Price Analysis: The Indicators’ Point of View
The price action is ranging below $0.10000 since the 19th of August. And since then, the RSI line are ranging below 50%. But on the 6th of September, the price broke out into the upper zone of the indicator. And it is now measuring 60.87%. The Moving Average Convergence and Divergence also show market swings. The histograms (both positive histograms and Negative histograms) did not have much height though. It is confirming the indecision in the market.
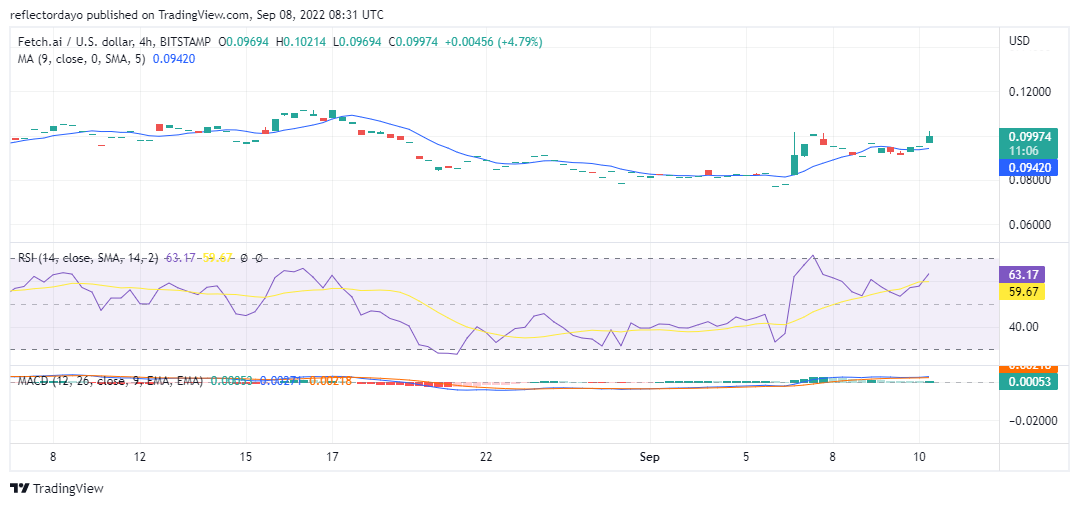
Fetch.ai: FET/USD 4-Hour Chart Outlook
Many of the four-price doji candlesticks are common here. At such times of trading session, none of the market players could influence the price. Today’s session also opened with the four-price doji candle. But, in the second hour, bulls were able to push the price up. And so according to the two indicators, the price continues in the upper territory, which signifies an up-trending market. Perhaps such strong bullish moves can revive activities in the market.
Related
Join Our Telegram channel to stay up to date on breaking news coverage