Join Our Telegram channel to stay up to date on breaking news coverage
Bears may exert more pressure in Fantom Market
Fantom may decrease to $0.18 and $0.17 levels provided the support level of $0.19 does not hold. The price rejection at $0.19 level may bounce up price towards the resistance level of $0.20, $0.21 and $0.22 levels.
Fantom Price Analysis – October 15
FTMUSD Market
Key levels:
Resistance levels: $0.20, $0.21, $0.22
Support levels: $0.19, $0.18, $0.17
FTMUSD Long-term Trend: Bearish
Fantom is on the bearish movement in daily chart. The bearish journey started on 13 August is yet to come to an end. In other words, sellers are still in control of the Fantom market. Two weeks ago, there was a ranging movement within $0.21 and $0.20 levels. Sellers’ momentum increased on 10 October, the support level of $0.20 was broken downside to test the support level of $0.19. Further price decrease envisaged.
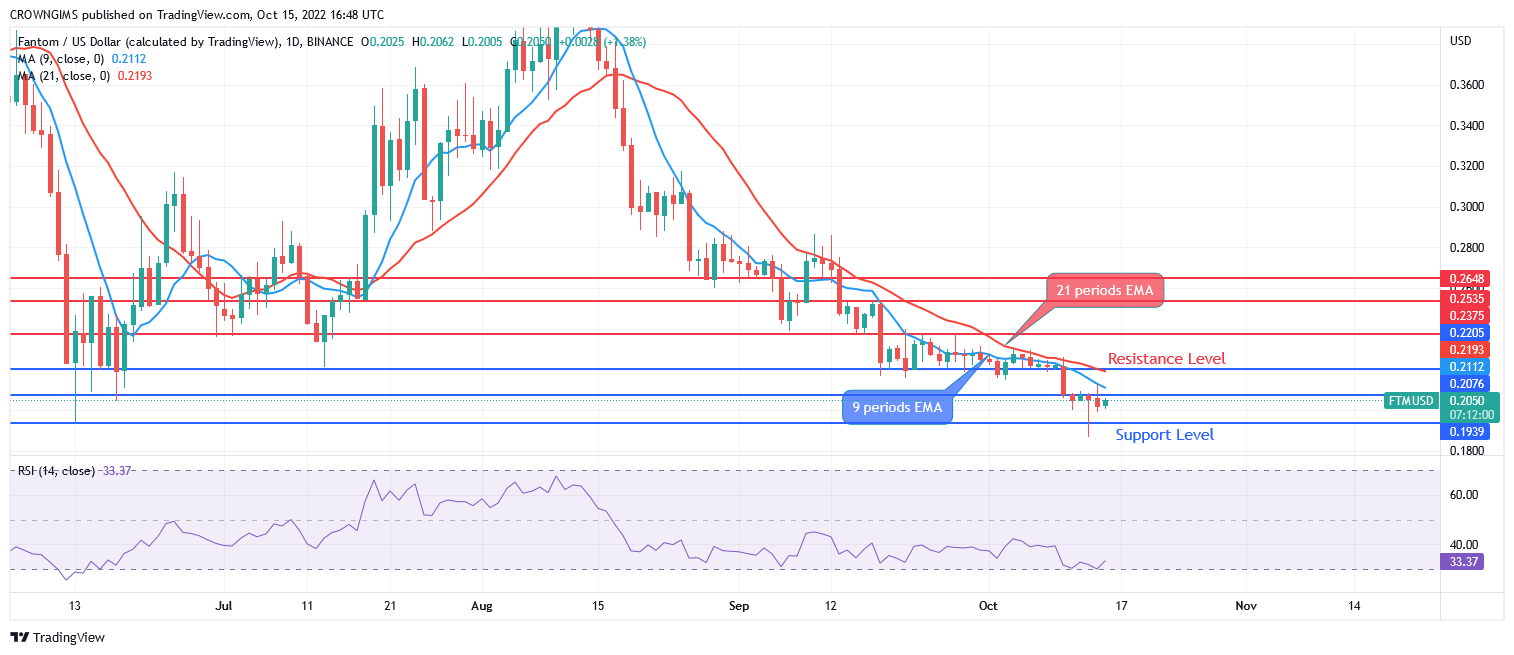
Fantom price is trading below the 9 periods EMA and 21 periods EMA at close distance indicating low momentum. The relative strength index period 14 is at 33 levels with the signal line displaying bullish direction. The price may decrease to $0.18 and $0.17 levels provided the support level of $0.19 does not hold. The price rejection at $0.19 level may bounce up price towards the resistance level of $0.20, $0.21 and $0.22 levels.
Your capital is at risk
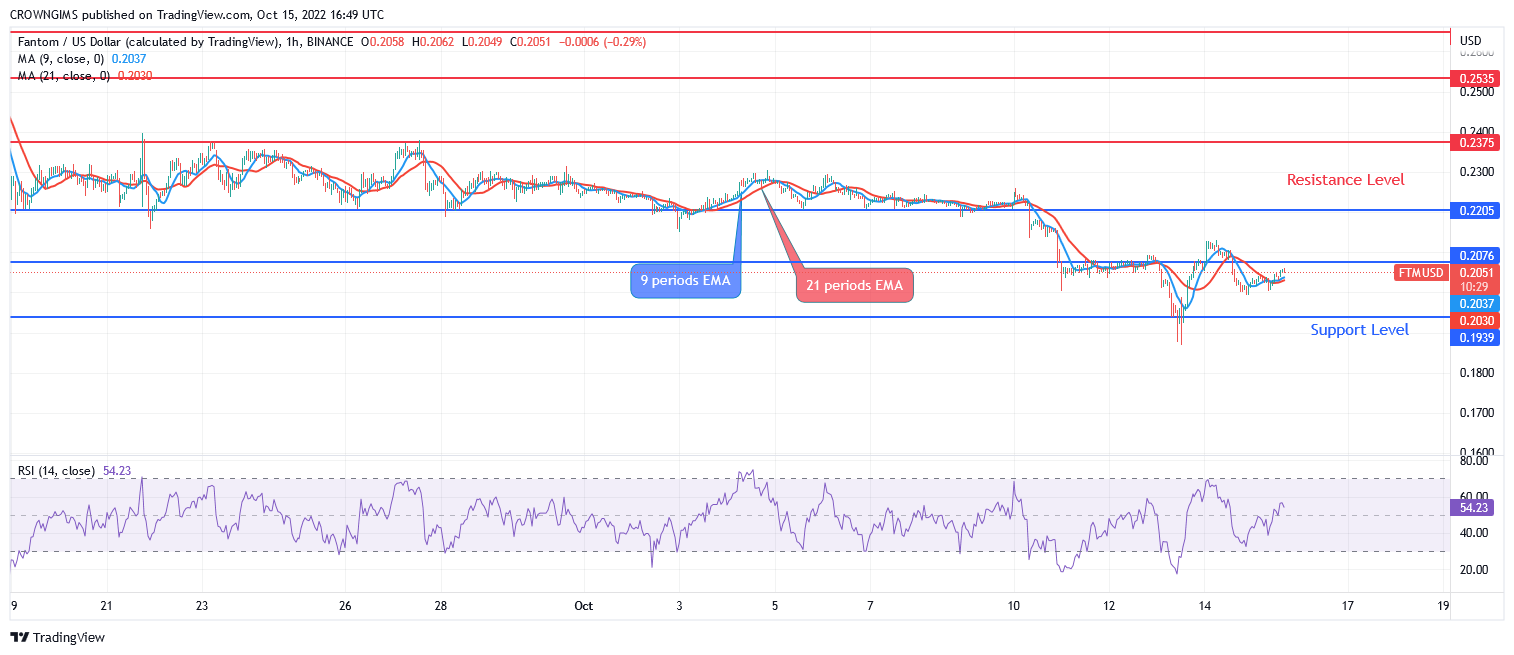
FTMUSD Medium-term Trend: Bearish
Fantom is on the bearish movement in the medium-term outlook. Last week, the crypto was on the ranging movement within the resistance level of $0.22 and support level of $0.21. Bears’ momentum increases and the support level of $0.20 is broken downside and $0.19 level is tested.
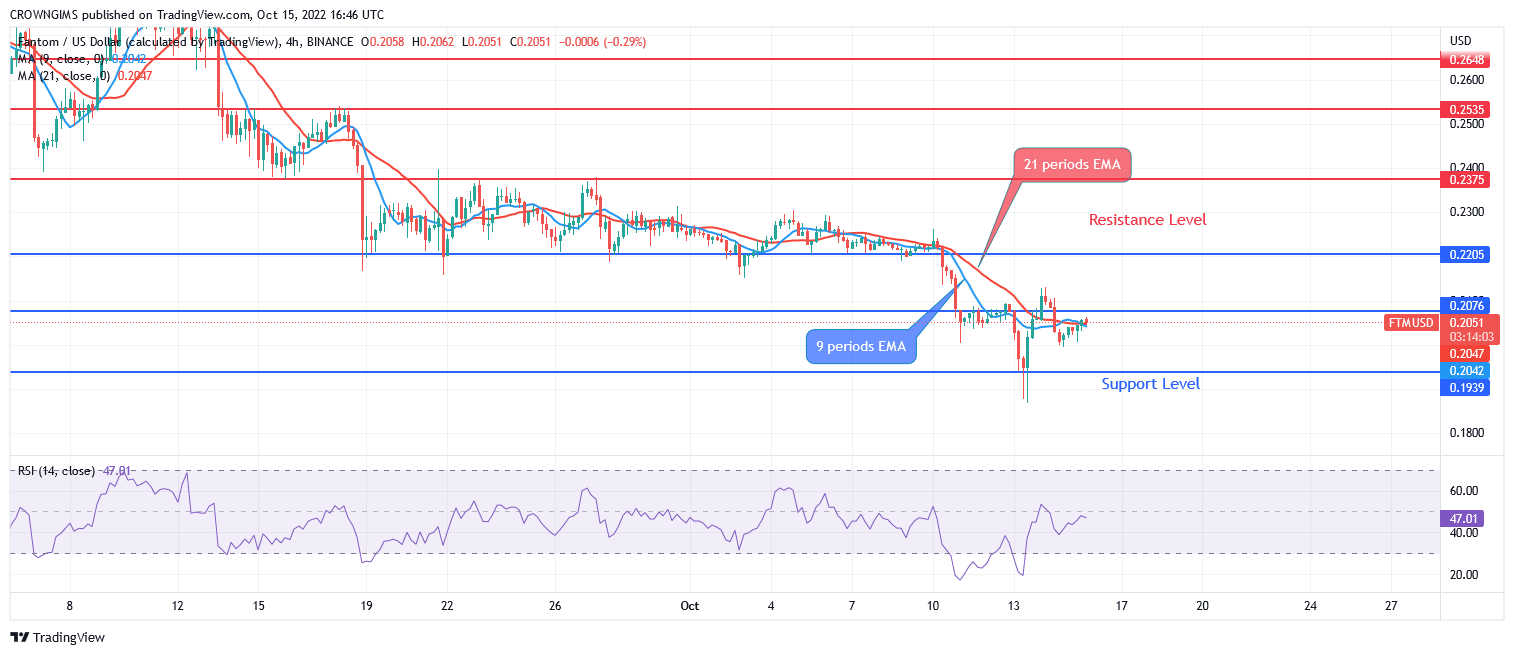
The two EMAs are fairly separated from each other and the price is trading below the two EMAs, indicating a bearish market. The Relative Strength Index period 14 is at 46 levels and the signal line pointing up which indicate a buy signal.
Join Our Telegram channel to stay up to date on breaking news coverage