Join Our Telegram channel to stay up to date on breaking news coverage
The Fantom price prediction shows that FTM is currently changing hands at $0.35 as the technical indicator faces the north.
Fantom Prediction Statistics Data:
- FTM price now – $0.35
- FTM market cap – $1.1 billion
- FTM circulating supply – 2.8 billion
- FTM total supply – 3.1 billion
- FTM CoinMarketCap ranking – #58
FTM/USD Market
Key Levels:
Resistance levels: $0.42, $0.44, $0.46
Support levels: $0.30, $0.28, $0.26
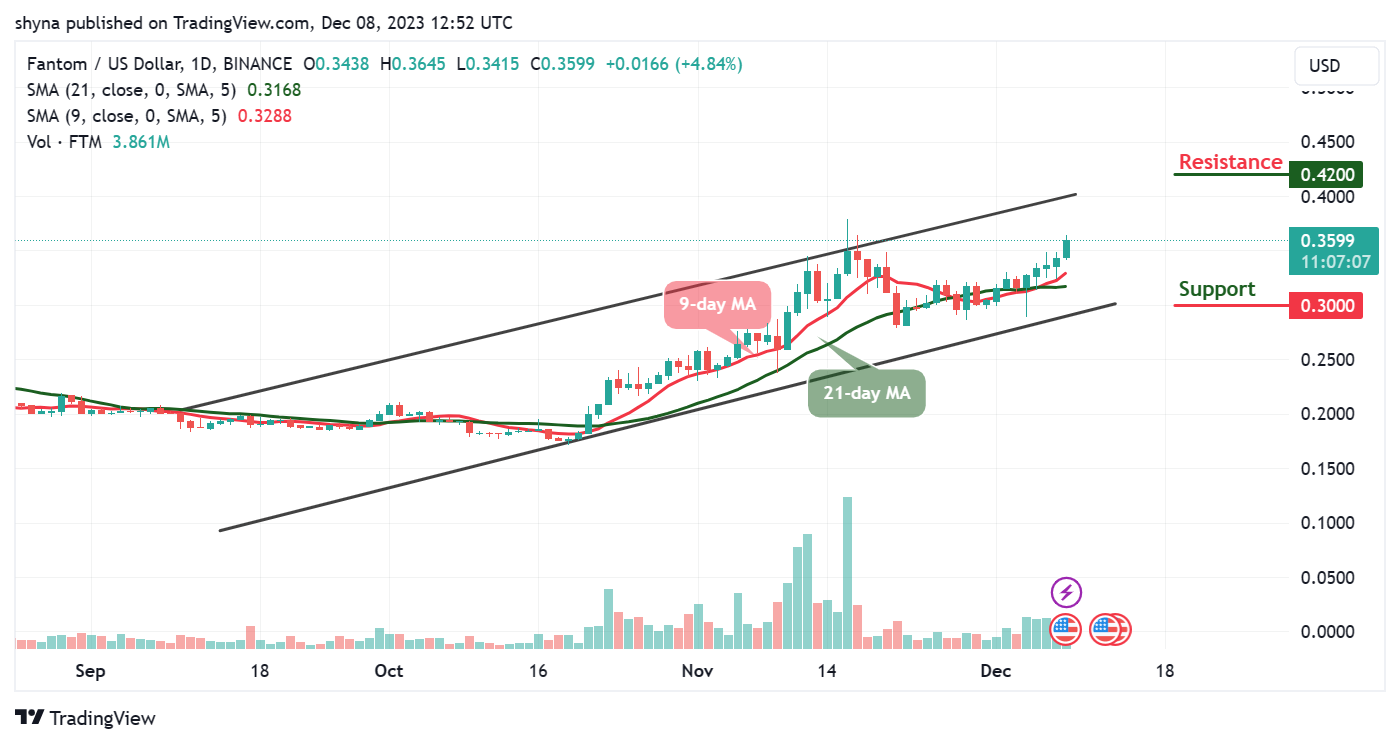
FTM/USD is trading at around $0.35, and once it manages to surpass the resistance of $0.38, the next target could be located at $0.40 where it could trade above the upper boundary of the channel. However, a push from here could send the price straight to the resistance level of $41, but if the current level fails to hold strong, the Fantom (FTM) could slip below the support level of $0.33.
Fantom Price Prediction: Is Fantom Ready for More Upsides?
Looking at the daily chart, the Fantom bulls are dominating the market as the buyers keep the price above the 9-day and 21-day moving averages, FTM/USD may likely hit the resistance levels of $0.42, $0.44, and $0.46 respectively. In addition, any bullish movement above these key resistance levels may likely encourage further buying.
Nonetheless, any bearish movement below the moving averages may decline toward the critical supports at $0.30, $0.28, and $0.26. Meanwhile, looking at the moving averages, Fantom may tend to follow an upward trend as the coin moves toward the upper boundary of the channel, suggesting bullish movement.
FTM/BTC Begins the Upward Movement
Against Bitcoin, the Fantom price is attempting to cross above the 9-day and 21-day moving averages which could hit the nearest resistance at 850 SAT. Therefore, unless this resistance effectively holds and the price ends up closing above it, there might not be any reason to expect a long-term bullish reversal.
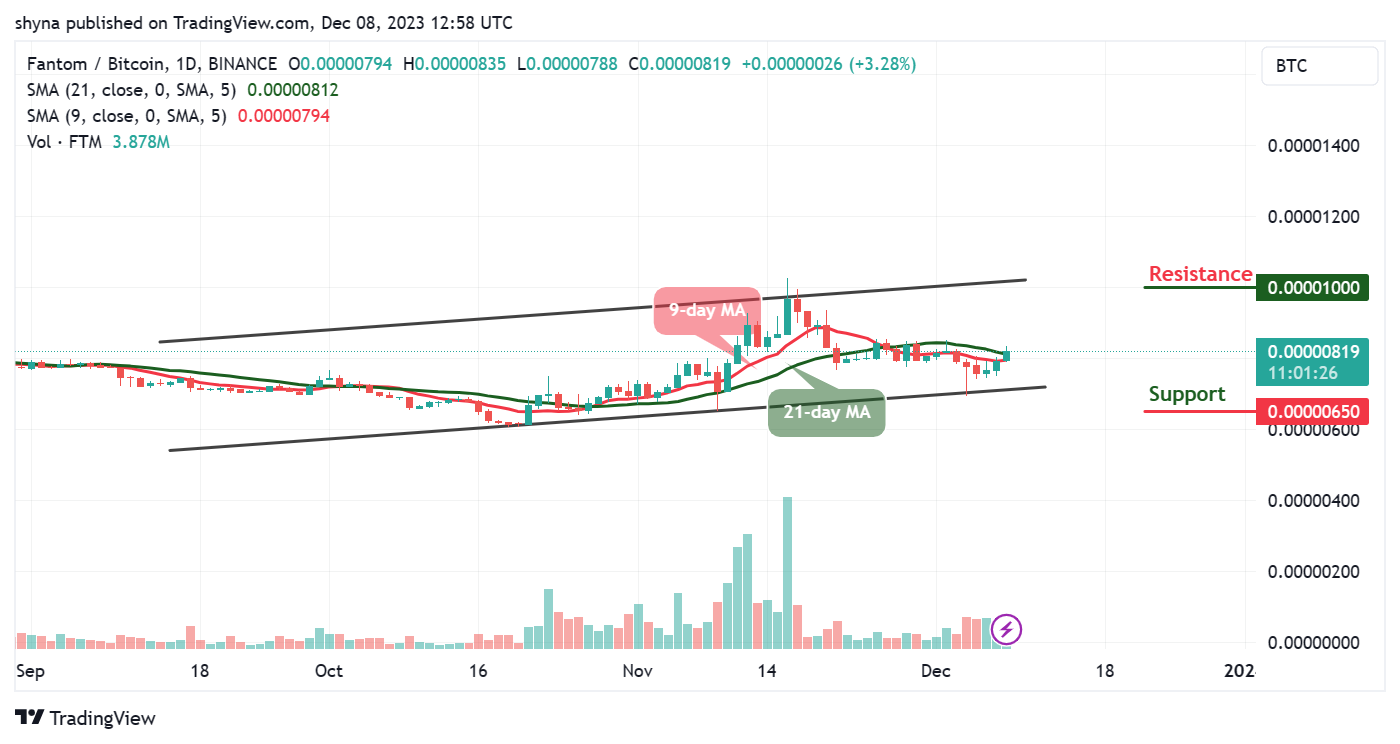
However, any bearish movement toward the lower boundary of the channel could refresh lows under 788 SAT as a possible bearish continuation may likely meet the major support at 650 SAT and below. From above, the buyers may push the coin to hit the potential resistance at 1000 SAT and above. Meanwhile, the 9-day MA may cross above the 21-day MA to suggest more bullish signals.
Alternatives to Fantom
At present, the Fantom price is experiencing a notable upward surge, currently hovering at $0.35. This optimistic trend is further supported by a bullish crossover above both the 9-day and 21-day moving averages. Looking forward, should Fantom sustain this positive momentum, there’s a chance it could breach the upper boundary of its trading channel.
Nevertheless, in contrast between Fantom (FTM) and the emerging Bitcoin Minetrix token, Fantom offers stability with an established market cap of $1.1 billion but may exhibit limited short-term growth potential. Conversely, Bitcoin Minetrix is currently achieving almost $5.2 million in its ongoing presale, suggesting the potential for substantial rapid gains.
Join Our Telegram channel to stay up to date on breaking news coverage