Join Our Telegram channel to stay up to date on breaking news coverage
EURCHF Price Analysis – June 13
EURCHF may reach the previous low of $1.116 to serve as a price retest before it continues the uptrend movement. In case the $1.116 level does not hold, the Bears may push down the price to reach $1.108 level.
EUR/CHF Market
Key levels:
Resistance levels: $1.126, $1.134, $1.141
Support levels: $1.116, $1.108, $1.098
EURCHF Long-term trend: Bearish
On the long-term outlook, EURCHF is bearish. The strong pressure of the Bears has turned to weak one immediately the currency pair price reached the support level of $1.116 level. The Bulls defended the level and strong bullish candles emerged, the price was pushed up towards the resistance level of $1.126 level. At the same level, an inverted pin bar emerged which is a bearish reversal signal. Today, a strong daily bearish candle formed and the price is heading towards a previous low of $1.116.
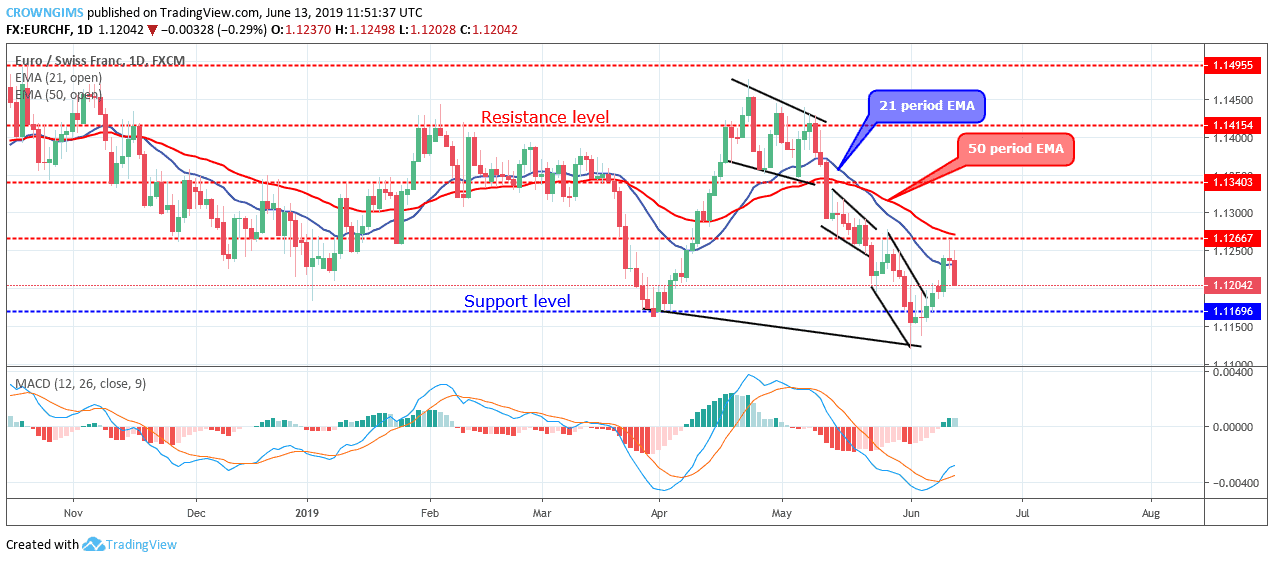
The currency pair is directly in touch with the two EMAs; EURCHF price is trading under the 21 period EMA and 50 periods EMA at very close range, which indicate that the Bears’ momentum is weak. Meanwhile, the Moving Average Convergence Divergence period 14 with its histogram is above zero levels and the signal line points up to indicate a buy signal.
EURCHF may reach the previous low of $1.116 to serve as a price retest before it continues the uptrend movement. In case the $1.116 level does not hold, the Bears may push down the price to reach $1.108 level.
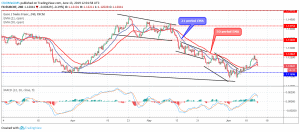
EURCHF medium-term Trend: Bearish
EURCHF is bearish on the medium-term outlook. EURCHF price was bullish yesterday after it crossed the two dynamic support and resistance level. The price tested $1.126 supply level. A Tweezer Top candle pattern formed and the price began to decrease again towards the previous low.

EURCHF is trading under the 21 periods EMA and 50 periods EMA. The MACD period 12 with its histogram is below the zero levels and the signal lines pointing down to connote sell signal.
Please note: insidebitcoins.com is not a financial advisor. Do your own research before investing your funds in any financial asset or presented product or event. We are not responsible for your investing results.
Join Our Telegram channel to stay up to date on breaking news coverage