Join Our Telegram channel to stay up to date on breaking news coverage
EURCHF Price Analysis – April 17
In case the Bulls break up the resistance level of $1.141, the bullish trend will extend to $1.149 price level. Should the mentioned resistance holds, the bearish trend may commence.
EUR/CHF Market
Key levels:
Resistance levels: $1.141, $1.149, $1.157
Support levels: $1.134, $1.126, $1.116
EURCHF Long-term trend: Bullish
EURCHF is bullish on the long-term outlook. The bearish momentum rolled down the EURCHF and found support at $1.116. The price bounced at the support level of $1.116 with the formation of a reversal candle pattern called an inverted hammer and the price rallied to the north. It broke the barrier at $1.1266 and $1.1340 and increased towards the resistance level of $1.1415.
The 21 periods EMA is trying to cross over the 50 periods EMA as a confirmation of the bullish trend. The currency pair is already moved above the two EMAs which indicates strong bullish momentum in the EURCHF market on the daily chart. The Relative Strength Index period 14 is at 70 levels with a signal line pointing to the north which connotes continuation of the bullish trend.
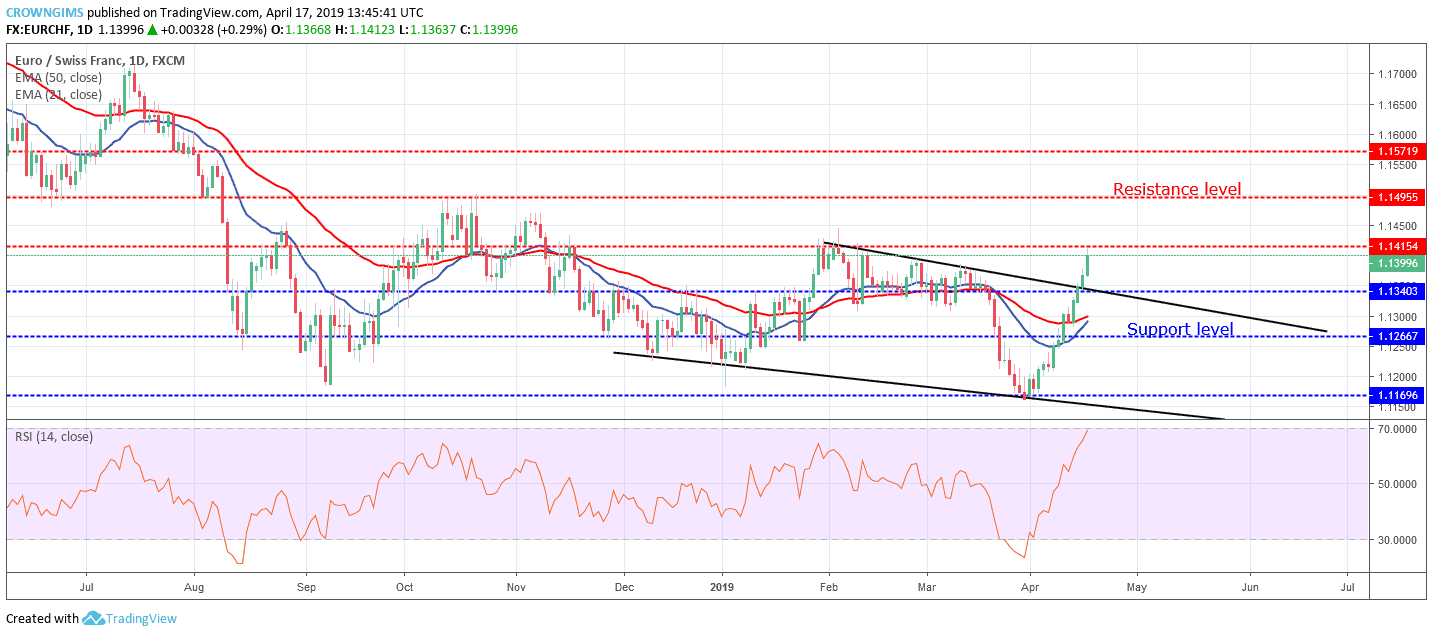
In case the Bulls break up the resistance level of $1.141, the bullish trend will extend to $1.149 price level. Should the mentioned resistance holds, the bearish trend may commence.
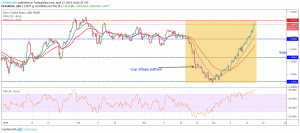
EURCHF medium-term Trend: Bullish
EURCHF is on the bullish trend on the medium-term outlook. EURCHF has been bullish on the 4-hour charts for many days. The bullish trend has resulted in the formation of a cup-like shape pattern. Price retracement is highly envisaged at the resistance level of $1.1415. the two EMAs followed the trend of the price which connotes that the Bulls are fully in control of the EURCHF market.

The Relative strength Index period 14 is at 80 levels (overbought level) and the signal line bending down to indicate sell signal.
Please note: insidebitcoins.com is not a financial advisor. Do your own research before investing your funds in any financial asset or presented product or event. We are not responsible for your investing results.
Join Our Telegram channel to stay up to date on breaking news coverage