Join Our Telegram channel to stay up to date on breaking news coverage
ETH Price Prediction – October 29
Ethereum price is showing some positive signs above $180 against USD; the price may likely start a fresh increase above $188.
ETH/USD Market
Key Levels:
Resistance levels: $200, $210, $220
Support levels: $155, $145, $135
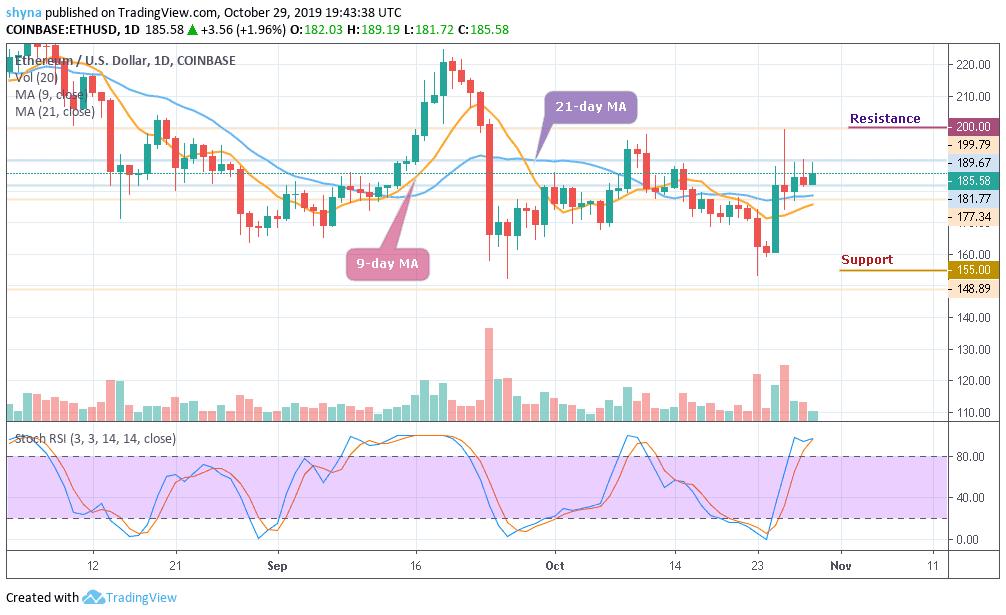
ETH/USD has jumped from $181.77 to touch the intraday high at $189.67 in a matter of hours. The crypto has retreated to $185.58 as at the time of writing but the pair still retains the bullish momentum. In the short term, ETH/USD has gained more than 1.9% since the beginning of the trading day. For now, Ethereum (ETH) is one of the top cryptos in the market cap.
However, due to a strong upside movement of the coin, ETH/USD broke free from the recent downtrend of October 24 and moved to touch the highest level of the month. Looking at the daily chart, the $180 remains to be a key support zone and if it is broken, the sell-off may be extended towards $160 support level.
Currently, the price of the coin is changing hands at $185.58 level and the bulls are still injecting strong buying pressure into the market. In other words, if the price of Ethereum moves below the moving averages of 9-day and 21-day, and the bears step back into the market, the price could be pushed to the support of $155, $145 and $135 levels.
More so, the stochastic RSI is at the overbought territory, which indicates the continuation of the bullish trends and should in case the bulls put more effort by pushing the price higher, further resistance could be found at $200, $210 and $220 levels before the market makes another attempt at $230 level.
Against Bitcoin, Ethereum (ETH) is currently changing hands at 0.0203 BTC after witnessing some heavy bearish moment in the last few days. Looking at the daily chart, the current trend of the coin is perpetually looking bullish in the short-term, moving towards the 9-day and 21-day MA within the descending channel.
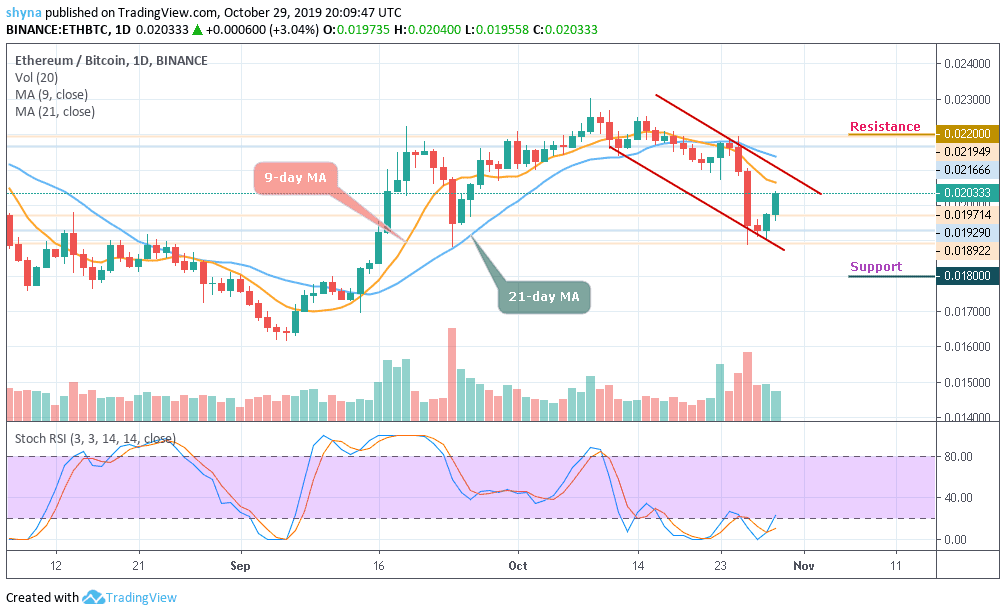
Meanwhile, the resistance levels to look for are 0.022 BTC and 0.023 BTC while the closest support levels to keep an eye on are 0.018 BTC and potentially 0.017 BTC. The stochastic RSI moves into the oversold territory, which may give more bullish signals in the nearest term.
Please note: Insidebitcoins.com is not a financial advisor. Do your research before investing your funds in any financial asset or presented product or event. We are not responsible for your investing results.
Join Our Telegram channel to stay up to date on breaking news coverage