
Join Our Telegram channel to stay up to date on breaking news coverage
ETH Hikes Relatively – October 22
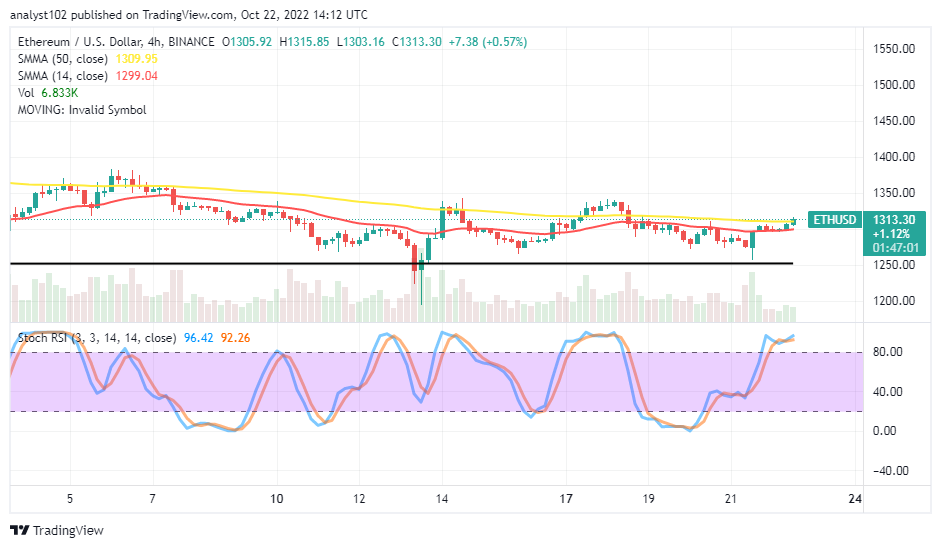
ETH holds tightly around the $1,250 line against the US Dollar worth. Over fifteen hours of today’s trading session, the price has denatured between $1,315.85 and $1,294.87 value lines as the current percentage rate of trading is at 1.18 positive.
ETH Hikes Relatively: ETH Market
Key Levels:
Resistance levels: $1,500, $1,750, $2,000
Support levels: $1,100, $1,000, $900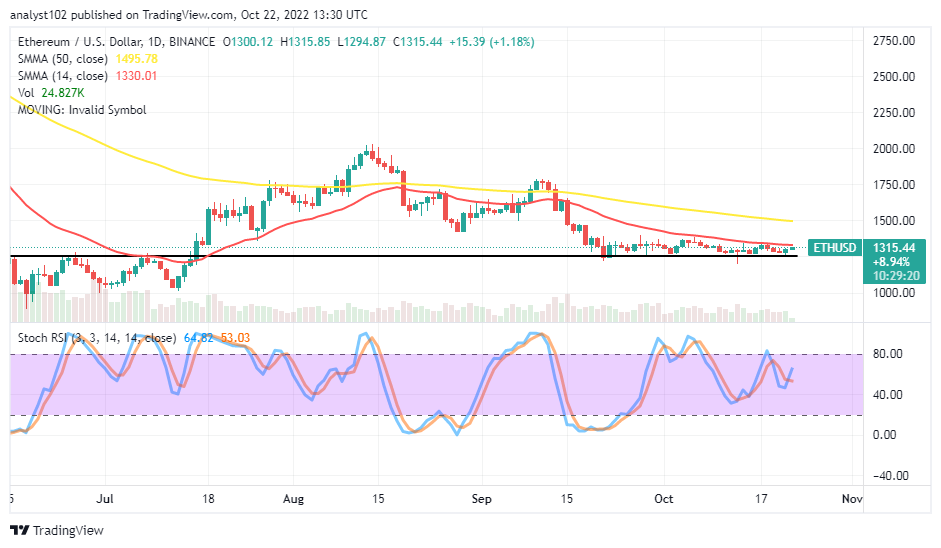 ETH/USD – Daily Chart
The daily chart reveals ETH holds firmly around the $1,250 trading line against the US Dollar market. The 14-day SMA indicator is at $1,330.01 point, underneath the $1,495.78 value line of the 50-day SMA indicator. The horizontal line drew at the trading point mentioned earlier. The Stochastic Oscillators have been in the range values of 40 and 80 over time. And they are presently trying to cross northward at 53.03 and 64.82 range values.
Will the ETH/USD market drop against the $1,250 level?
It obtained that the crypto market is trading between the space of the 14-day SMA and the horizontal line drawn at the $1,250 level as ETH holds firmly around the value line in question. An attempt to favor a southward-moving direction against the value line will potentially force back the trading point lower to find support around the support levels of either $1,100 or $1,000 in the long run.
On the downside of the technical analysis, a sudden northward push against the trending zone of the smaller SMA will probably cause a continual rallying motion that can lead the trading situation to reach a resistance spot around the $1,500 level. In the meantime, the price tends to position around the value point in the following days’ operations to cause an indecision trading condition. Therefore, if that sentiment plays out, traders stay clear of the market in the meantime.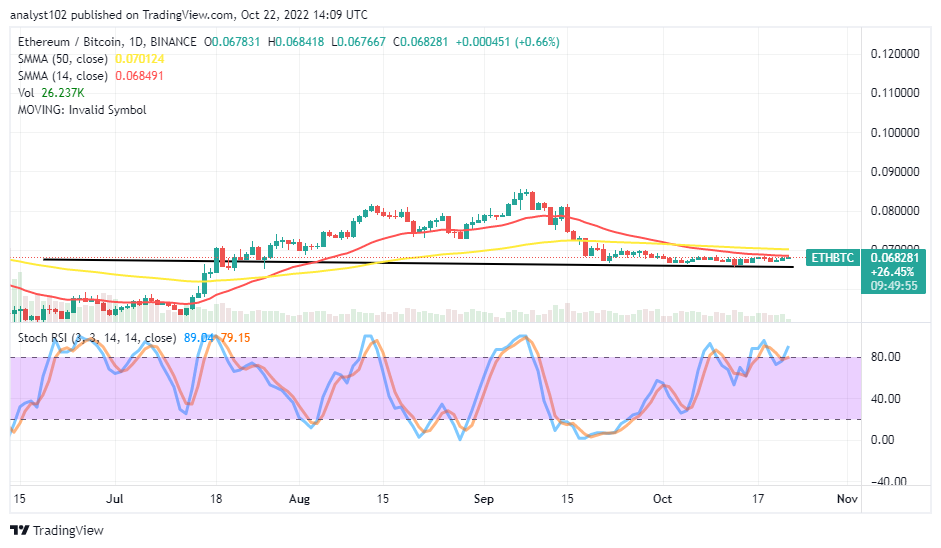
ETH/BTC Price Analysis
ETH holds merely stronger at a lower-high trading spot closely around the smaller SMA trend line. The 50-day SMA indicator is above the 14-day SMA indicator. The horizontal line is drawn beneath the trend lines of the trading SMA indicators to mark the pivotal zone the pairing crypto trade has been building a baseline. The Stochastic Oscillators have crossed their lines northbound to reach 79.15 and 89.04 range values. That shows that the base crypto is struggling to move against its counter-trading crypto.
Related
Join Our Telegram channel to stay up to date on breaking news coverage