Join Our Telegram channel to stay up to date on breaking news coverage
ETH Continues to Fall Aggressively – June 18
The ETH/USD trade continues to fall aggressively through variant points to a lower-trading zone that has bereft a tangible sign of swinging back upward. Price is now trading between $1,096 and $974 at a negative percentage rate of 8.16.
Ethereum (ETH) Statistics:
ETH price now – $996.63
ETH market cap – $120.5 billion
ETH circulating supply – 121.2 million
ETH total supply – 121.2 million
Coinmarketcap ranking – #2
ETH Continues to Fall Aggressively: ETH Market
Key Levels:
Resistance levels: $1,250, $1,500, $1,750
Support levels: $750, $500, $250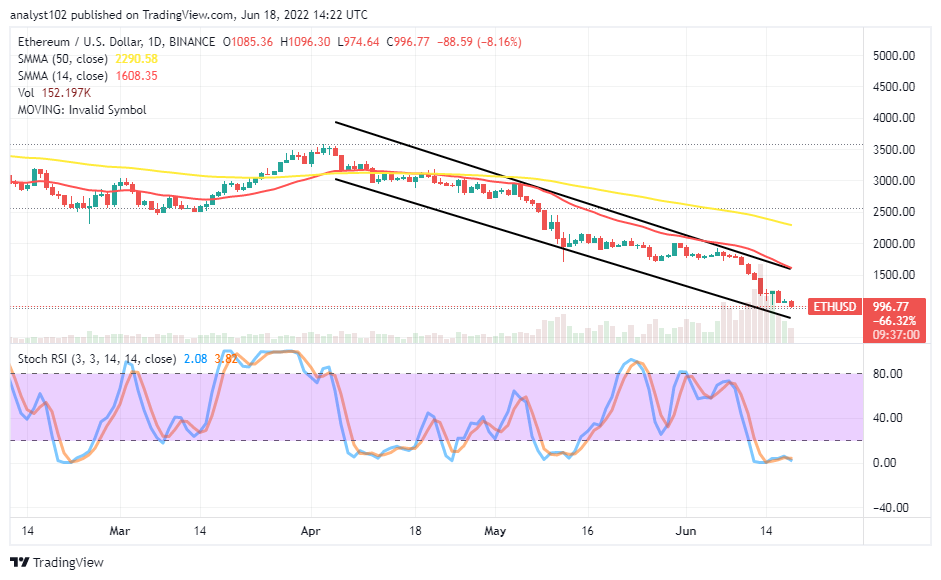 ETH/USD – Daily Chart
The daily chart reveals the Ethereum market continues to fall aggressively in the bearish channel trend lines. The 14-day SMA indicator moves alongside the upper bearish trend line underneath the 50-day SMA indicator. The Stochastic Oscillators are dipping in the oversold region, showing the market is on a high-intense falling force. The current bearish trading candlestick confirms the crypto economy may still run downward through other lower support levels.
Should the ETH/USD traders keep bearish-trading bias below the $1,000 psychological level?
Selling orders executed at variant points above the $1,000 psychological level may be left to run further in the downward direction by using a trailing stop-loss order as the ETH/USD market continues to fall aggressively toward the lower bearish channel trend line drawn. Long-position takers may have to stay off the market for a while. The support level at $750 will have to be looked onto to serve against any further free fall-offs in an extension of the current downward-trending cycle.
On the downside of the technical analysis, the market has predominated by falling forces traders will have to work on getting a reliable selling entry order before execution. As the $1,000 psychological support point has previously breached southward, bulls’ energy now tends to be in jeopardy of exposing to more downs afterward if not a single bullish candlestick emerges soon. Bears needed to maintain pushes to the downside direction in a slow and steady moving mode.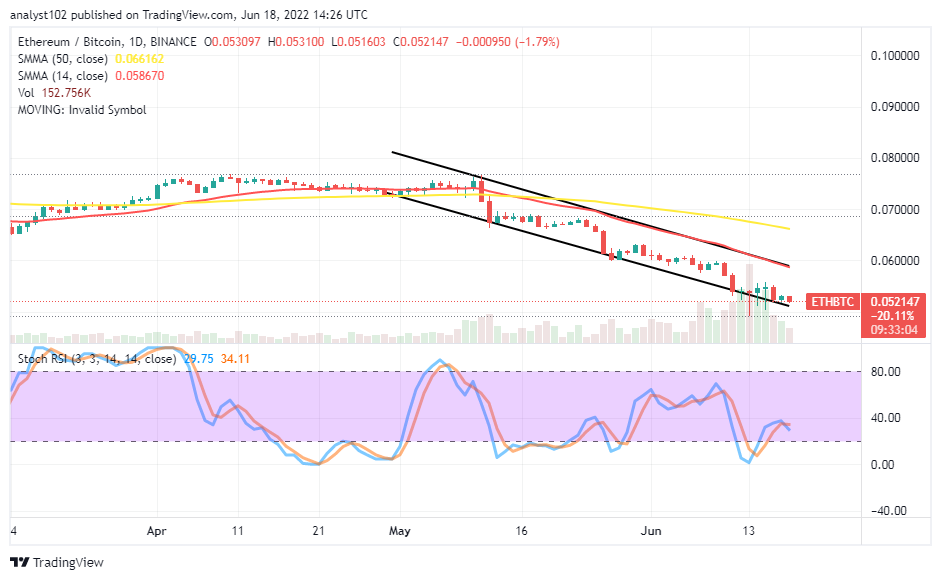
ETH/BTC Price Analysis
Ethereum has continued to drop closely above the lower bearish channel trend line drawn over time. The cryptocurrency pair price continues to fall far below the SMA trend lines. The 14-day SMA indicator is featured southward alongside the upper bearish channel trend line below the 50-day SMA indicator. The Stochastic Oscillators have crossed southbound after trying to spring from the oversold region recently. The sequential featuring of the candlesticks to the south direction is still intact to portend the base crypto may not come out of declining against the counter crypto in the near time.
Looking to buy or trade Ethereum (ETH) now? In-Content Heroes link!
68% of retail investor accounts lose money when trading CFDs with this provider.
Read more:
Join Our Telegram channel to stay up to date on breaking news coverage