Join Our Telegram channel to stay up to date on breaking news coverage
ETH Hikes Relatively – August 17
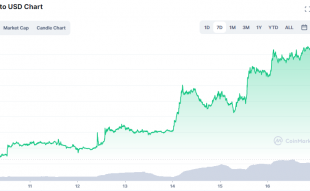
The present situation portrays that Ethereum trading activity hikes relatively against the valuation of the US Dollar as the rallying motion continues to resurface mostly. There have been a low of $1,362.95 and a high of $2,022.79 in the last thirty days’ sessions. Price is trading around $1,952.06 as of the time of writing, keeping a positive percentage rate of 3.97.
Ethereum (ETH) Statistics:
ETH price now – $1,950.85
ETH market cap – $237.5 billion
ETH circulating supply – 122 million
ETH total supply – 122 million
Coinmarketcap ranking – #2
ETH Hikes Relatively: ETH Market
Key Levels:
Resistance levels: $2,000, $2,250, $2,500
Support levels: $1,500, $1,250, $1,000 ETH/USD – Daily Chart
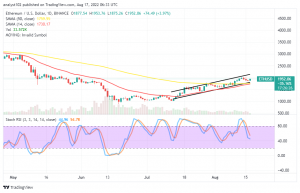
The daily chart reveals the Ethereum market hikes relatively trading against the trade worth of the USD as it has been able to extend in a rallying-moving mode past the trend lines of the SMAs. There a little space between the SMAs as the 50-day SMA indicator is at $1,759.95 over the $1,730.17 value line of the 14-day SMA indicator. And they are around the lower bullish trend line drawn. The Stochastic Oscillators have crossed southbound to place around 54.78 and 44.96 range lines. At the moment, they seemingly attempt to cross their lines northbound.
Your capital is at risk.
Will the Ethereum trade keep rallying against the US Dollar furthermore?
Some indications are in the support of Ethereum’s probable index of maintaining a rallying-moving mode against the US currency as the crypto economy hikes relatively to the north side in a smaller bullish channel trend line over time. Currently, price tends to lose the downward force around the SMAs’ points involving the lower bullish trend line to find support. Therefore, long-position takers should be alert to place a buying order while that presumption has a higher sign of materializing.
On the downside of the technical analysis, the ETH/USD market sellers have to put their selling order executions on hold for a while until the market pushes back upward to get resisted a higher-resistance level near the upper bullish trend line at $2,137.27 before making a come-back afterward. However, a sustainable fearful breakout of the value line may nullify the notion of seeing a downward motion coming forth.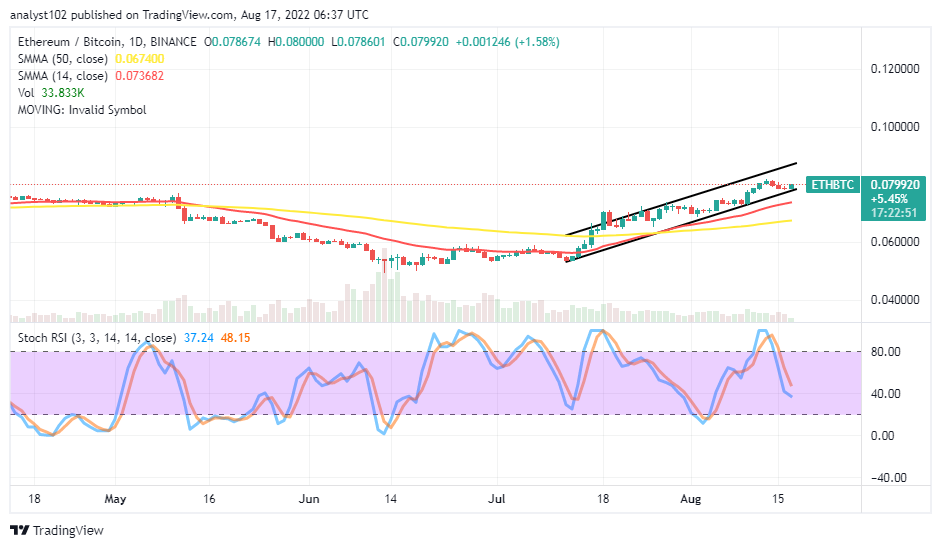
ETH/BTC Price Analysis
Ethereum has continued to maintain a higher-trending outlook against the trending ability of Bitcoin over several sessions. The cryptocurrency pair price hikes relatively at an upper spot within the bullish channel trend lines. The 50-day SMA indicator is underneath the 14-day SMA indicator. They are below the current trading spot for quite a while. The Stochastic Oscillators have crossed southbound to 48.15 and 37.24 range points. As of the time of writing, a bullish candlestick is the making, suggesting the possibility of the base crypto moving upward against its counter-trading crypto.
Read more:
Join Our Telegram channel to stay up to date on breaking news coverage