Join Our Telegram channel to stay up to date on breaking news coverage
ETH Price Prediction – June 10
The price to buy Ethereum may be facing a fresh round of selling as the coin remains at a risk of more downsides if it breaks the $240 support.
ETH/USD Market
Key Levels:
Resistance levels: $265, $270, $275
Support levels: $225, $220, $215
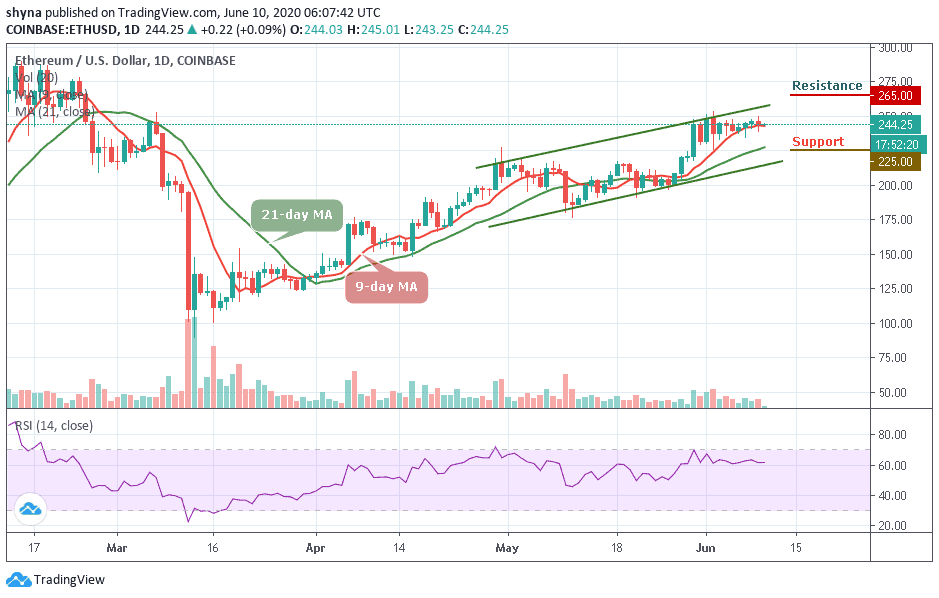
ETH/USD has been in consolidation since the rejection from highs close to $254 last week. The bulls were able to hold above $240. The choppy market continues to keep most of the buyers in the sidelines. If push comes to shove, a further retreat towards $235 and $230 could help revive the uptrend by encouraging more to buy Ethereum with PayPal and enter the market at a lower price in anticipation of gains above $250 and $280.
However, ETH/USD is still trading above the 9-day and 21-day moving averages at the time of writing, having tried to recover from the intraday low of $238.98. The technical indicator RSI (14) is currently moving above 60-level. More so, the second-largest crypto in the coin market cap, with a current market value of $27.25 billion is gaining 0.09% of its value since the beginning of today.
Moreover, the Ethereum price continues to follow the sideways movement within the channel, and any attempt to break below the 9-day moving average, the bears may step back into the market to reach the supports of $225, $220, and $215. In other words, if the bulls push the price above the upper boundary of the channel, the buyers may likely find resistance at $265, $270, and $275 levels.
Against Bitcoin, the market price remained in the ascending channel but the bears are trying to take over the market. ETH/BTC is currently trading at 0.024 BTC and the bulls couldn’t push the price to cross the channel. Looking at the chart, if the market continues to drop, the next key supports may likely be at 0.0235 BTC and below.
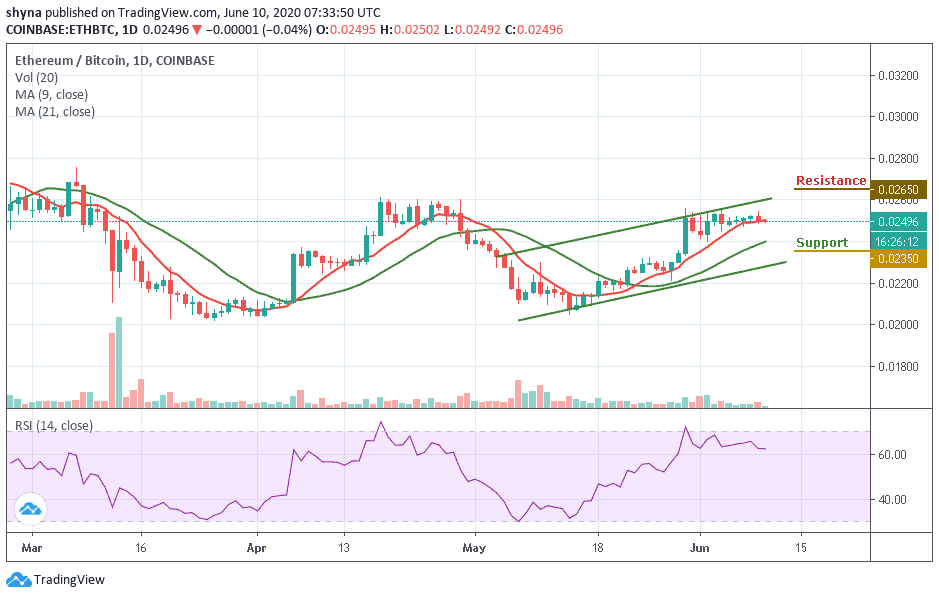
However, on the upside, a possible bullish movement may likely push the market above the channel, when this is done, the resistance level of 0.0265 BTC and above could be visited. The technical indicator RSI (14) is moving above 60-level and this indicates that the market may continue to follow a sideways movement.
Please note: Insidebitcoins.com is not a financial advisor. Do your research before investing your funds in any financial asset or presented product or event. We are not responsible for your investing results.
Join Our Telegram channel to stay up to date on breaking news coverage