Join Our Telegram channel to stay up to date on breaking news coverage
Ethereum Price Prediction – January 10
The market trade-worth of ETH/USD has continued to be on appreciation over a couple of days’ trading sessions until now. Initially, the crypto-pair maintained its north-path in bullish channels.
ETH/USD Market
Key Levels:
Resistance levels: $1,600, $1,800, $2000
Support levels: $1000, $800, $600
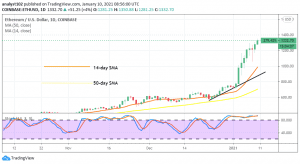
ETHUSD – Daily Chart
As distinctively being depicted by Japanese trading candlestick features; the formation of a set of bullish trend has dominated the ETH/USD chart. The two trading SMA indicators are located far below the trading price line. That shows that buying pressures still ongoing. The Stochastic Oscillators are dipped into the overbought region to consolidate their moves within it. That besides shows that price upsurge isn’t yet weak.
What’s the direction ETH/USD price may follow next?
The current big decimating line for the present ETH/USD market-bulls is at the $1,200 price level. It should serve as support for bulls to safely prolong their high-swinging moves. In that wise, a breach of key resistance at $1,400 will give way to achieving a more appreciative price worth above the market-point mentioned earlier.
Suggesting a resumption of a bearish move in the market of ETH/USD, a sudden and sharp bearish candlestick needs to emerge to engulf about four or five previously-formed bullish candlesticks to have a decent thought of getting a sell-entry point. In the meantime, market-value around $1,400 may witness a series of price convergences or rejections, in return may result in a bullish reversal pattern in a near trading session. 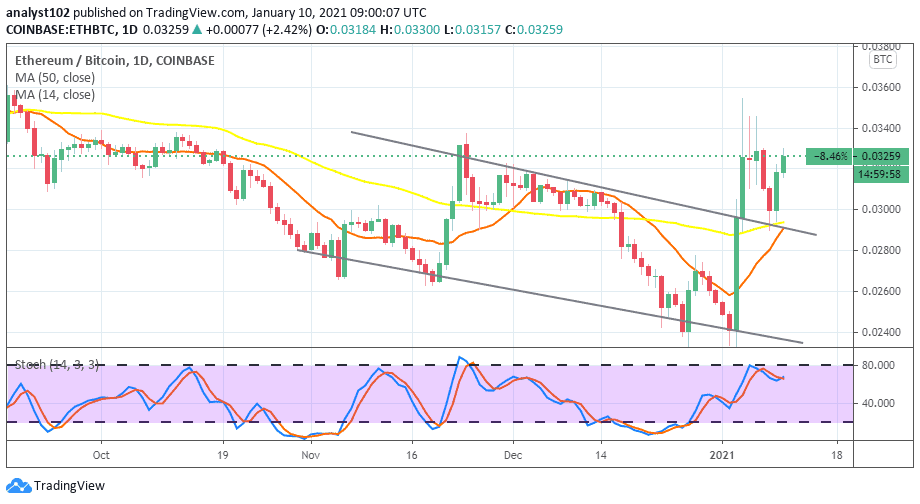
ETH/BTC Price Analysis
In the recent past, while comparing the market-worth of Ethereum with Bitcoin’s, the former was intensely under pressure by the latter-crypto’s value. The trading chart also shows that channel trend-lines representing bearish trend came into play. Meanwhile, on January 3, a spike occurred from the lower channel to briefly break past the upper channel trend-line at the B0.030 mark. In the subsequent trading day, the base currency managed to capitalize on it, to trade above the upper channel closer to B0.036 value. The Stochastic Oscillators are now attempting to cross hair northward below range 80. That signifies that the base currency is on the verge of regaining its strength against the counter trading instrument.
Join Our Telegram channel to stay up to date on breaking news coverage