Join Our Telegram channel to stay up to date on breaking news coverage
Ethereum Price Prediction – August 20
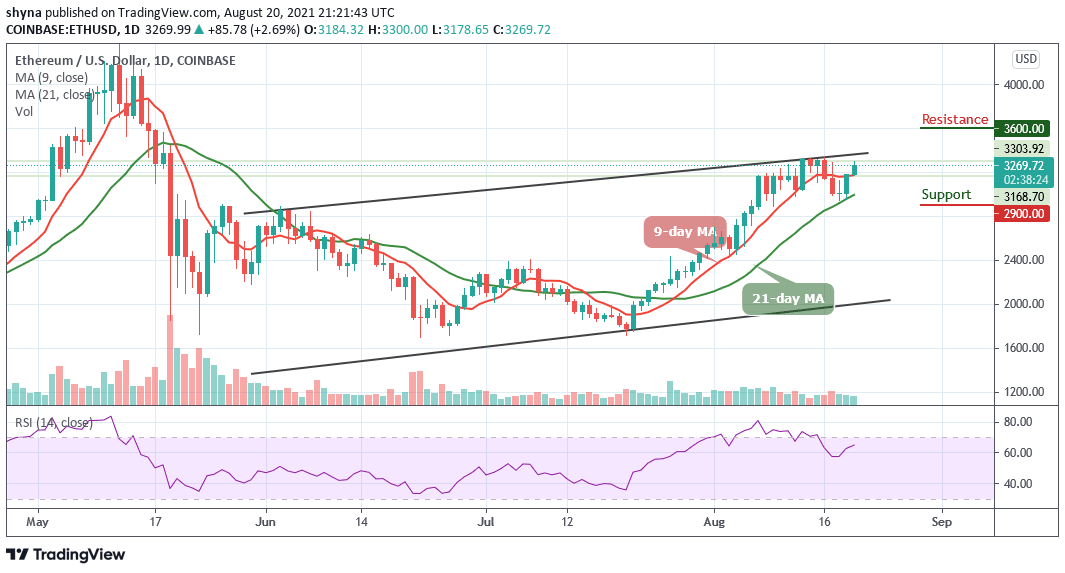
The Ethereum price consolidates and touches $3300 as the technical indicator Relative Strength Index (14) confirms the uptrend.
ETH/USD Market
Key Levels:
Resistance levels: $3600, $3700, $3800
Support levels: $2900, $2800, $2700

Following the dip on August 18, after touching the support at $2951, ETH/USD is now back above the 9-day and 21-day moving averages, preparing to send the price above the upper boundary of the channel. However, since the position at the vital $3300 level has been reclaimed by the bulls, the daily chart reveals that the Ethereum price has been strengthening its bullish case towards $3400. Although, the resistance at $3280 has been a hard nut to crack, and ETH/USD may need to push the market price above the channel.
Ethereum Price Prediction: Ethereum (ETH) May Recover More
At the time of trading, the Ethereum price is exchanging hands at $3269 after surging only 2.69% on the day. However, the intraday high of $3300 is now the next resistance target likely to stand in the way of the recovery to $3500. Meanwhile, the technical indicator reveals that the Relative Strength Index (14) recovers above 65-level which could hint that ETH/USD is now at the edge of a bullish breakout. Therefore, the support levels of $2900, $2800, and $2700 may come to play if the price crosses below the 9-day and 21-day MAs.
Nevertheless, ETH/USD is seen penetrating towards the upper boundary of the channel. More so, the break above this barrier is another signal needed for a bullish to press higher. More so, the Ethereum (ETH) has to break above $3500 before hitting the potential resistance levels at $3600, $3700, and $3800 respectively.
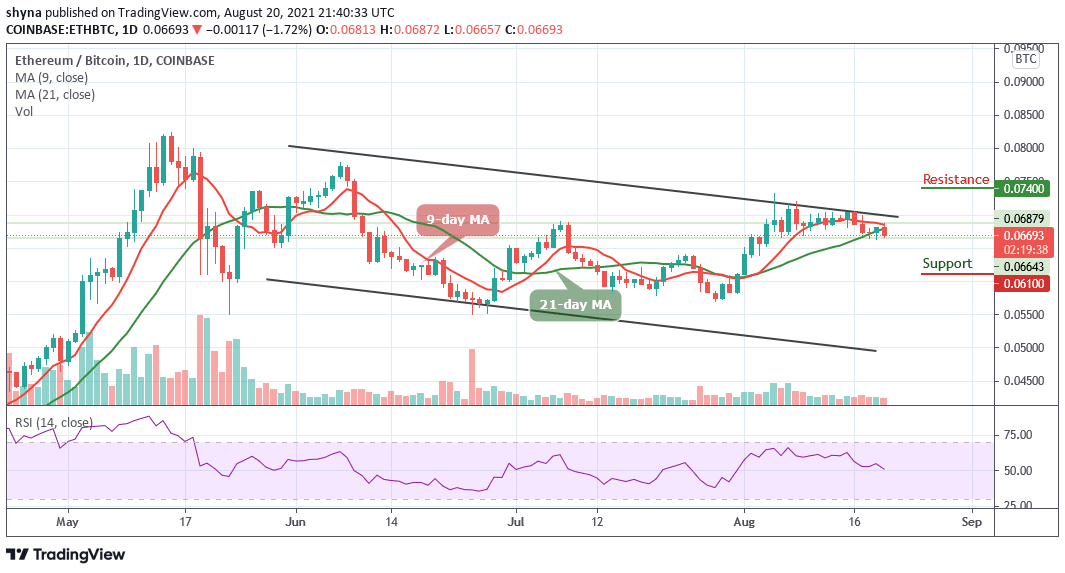
Against BTC, Ethereum is trading below the 9-day and 21-day moving averages within the channel and the price is now hovering at 6693 SAT as the Relative Strength Index (14) moves to cross below 50-level. Although the bears remain the dominant of the market while the bulls may need to break above the 9-day and 21-day moving averages to take charge.

However, the resistance levels to be reached are located at 7400 SAT and above. Conversely, a lower sustainable move below the moving averages could attract the sellers to retain the current market movement back with the next focus on 6100 SAT and below.
Looking to buy or trade Ethereum (ETH) now? Invest at eToro!
75% of retail investor accounts lose money when trading CFDs with this provider
Join Our Telegram channel to stay up to date on breaking news coverage

