Join Our Telegram channel to stay up to date on breaking news coverage
ETH Price Prediction – April 5
Ethereum (ETH) dropped by a small 0.79% today as the cryptocurrency failed to cross above the channel.
ETH/USD Market
Key Levels:
Resistance levels: $180, $190, $200
Support levels: $110, $100, $90
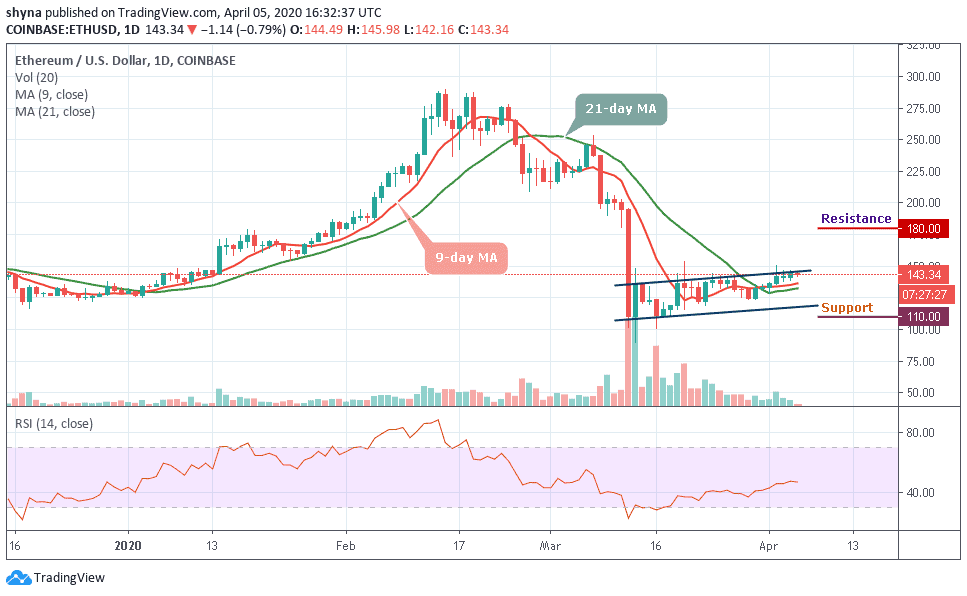
ETH/USD is currently dropping with a small 0.79% as the cryptocurrency rolled over from $145 to reach $143. However, the coin is now struggling to move above the $145 resistance level. A break above $145 could set Ethereum up for an epic surge that would likely see it headed above $160 and, perhaps, toward the $170 level. However, $145 and $150 will need to be broken for this to materialize.
However, if the sellers continue to add downward pressure to ETH, initial support is expected at $120. Beneath this, support can be found at $110, $100 and $90. On the other hand, if the bulls can defend the $142 level and allow ETH to rebound, an initial resistance is located at $150. Above this, additional resistance is expected at $180, $190 and $200.
More so, the RSI (14) is moving around 47-level which shows that the previous bullish momentum is starting to fade. If the RSI indicator manages to remain above the 47-level then the bulls stand a chance to allow Ethereum to rebound at $142. However, if it penetrates beneath, the cryptocurrency may resume a downward spiral.
Against BTC, Ethereum is still trading around the 9-day and 21-day moving averages within the descending channel and the price is now hovering at 2099 SAT as the RSI (14) moves in the same direction above the 41-level. Although the bears remain the dominant of the market, the bulls will need to break the upper boundary of the channel to take charge.
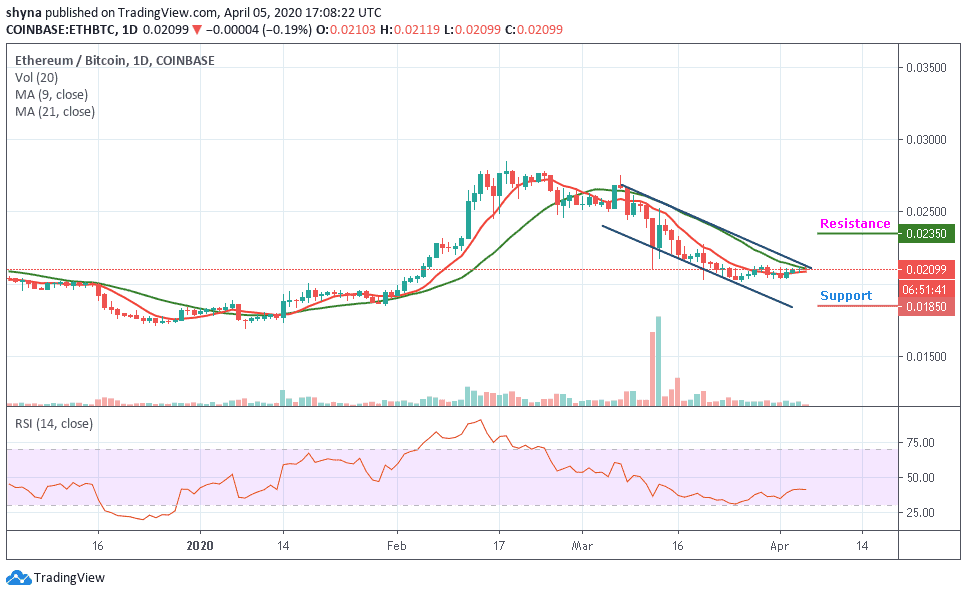
Moreover, the resistance levels to be reached are 2350 SAT and 2450 SAT. Conversely, a lower sustainable move below the moving averages may likely cancel the bullish pattern and this could attract the sellers coming back into the market with the next focus on 1850 SAT and 1750 SAT support levels.
Please note: Insidebitcoins.com is not a financial advisor. Do your research before investing your funds in any financial asset or presented product or event. We are not responsible for your investing results.
Join Our Telegram channel to stay up to date on breaking news coverage