Join Our Telegram channel to stay up to date on breaking news coverage
ETH Price Prediction – October 5
In the last 30 days, Ethereum surges from $174 to $221 and then drops back to $174. ETH price may likely cross $180 by next week.
ETH/USD Market
Key Levels:
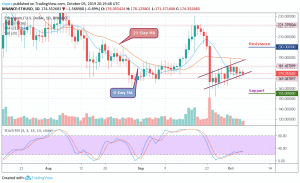
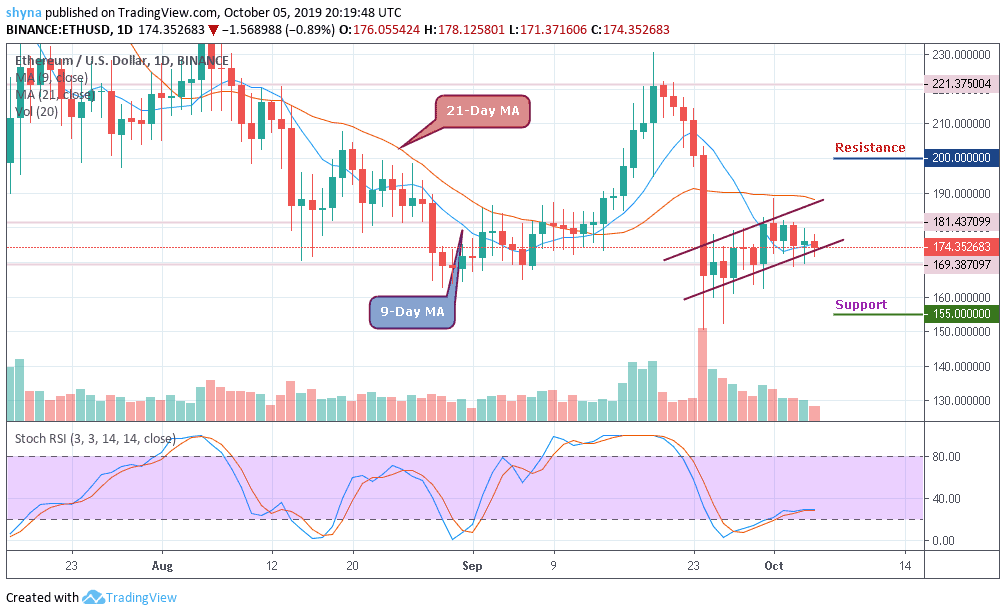
Resistance levels: $200, $205, $210
Support levels: $155, $145 $140
Ethereum, the second most talked about crypto in the present times after Bitcoin. The ETH currency has also given investors many reasons to invest huge amounts. It reached $318 this year. The current market performance may reflect sluggish trends but may change by the end of the year.
The price to buy Ethereum was bitten by the bear. The coin is currently experiencing a price drop. Both Ethereum and Bitcoin started with a drop today. The price is currently moving under 9-day and 21-day moving averages, exchanging hands at $174.35 which is yet to break down out of the channel to the downside.
However, a bearish drop may likely roll the market down to $155, $150 and $145 support levels while possible bullish surge may drive the market to $190 level, testing the upper channel boundary. Above the channel, $200, $205 and $210 levels may further provide resistance for the market. As the trading volume gets low, the stochastic RSI is coming out of the oversold zone and this may cause the bulls to step back into the market fully.
Looking at it against BTC, ETH has continued to trade sideways above the moving averages of 9-day and 21-day around 0.0215 BTC. The coin is secured from above by resistance at 0.0222 BTC and has been unable to rise above during the last month of September and this present October.
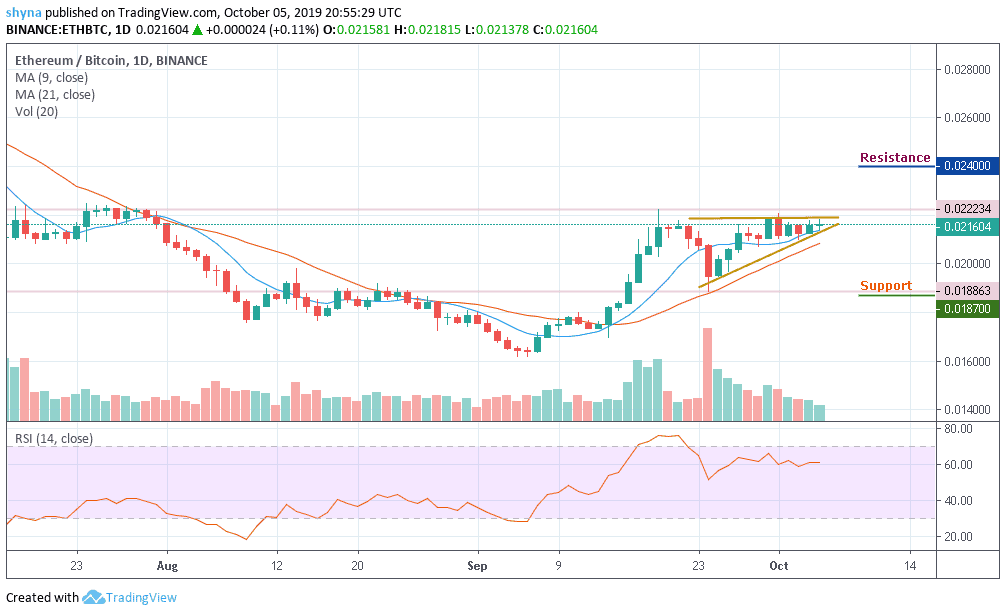
Meanwhile, the trading volume of ETH/BTC has dropped significantly and the RSI (14) remains above the 60 level which shows that the buyers are still in control over the market momentum; however, this seems to be very weak. If the price wants to break above the moving averages, it would need to see the RSI (14) rise higher from the 60 levels. The resistance levels to watch for are 0.024 BTC and above while the support levels are 0.0187 BTC and below.
Please note: Insidebitcoins.com is not a financial advisor. Do your research before investing your funds in any financial asset or presented product or event. We are not responsible for your investing results.
Join Our Telegram channel to stay up to date on breaking news coverage