Join Our Telegram channel to stay up to date on breaking news coverage
ETH Price Prediction – June 25
Ethereum (ETH) loses more than 0.29% in one day and goes below $250 level. The next target support may come at $220.
ETH/USD Market
Key Levels:
Resistance levels: $255, $260, $265
Support levels: $210, $205, $200
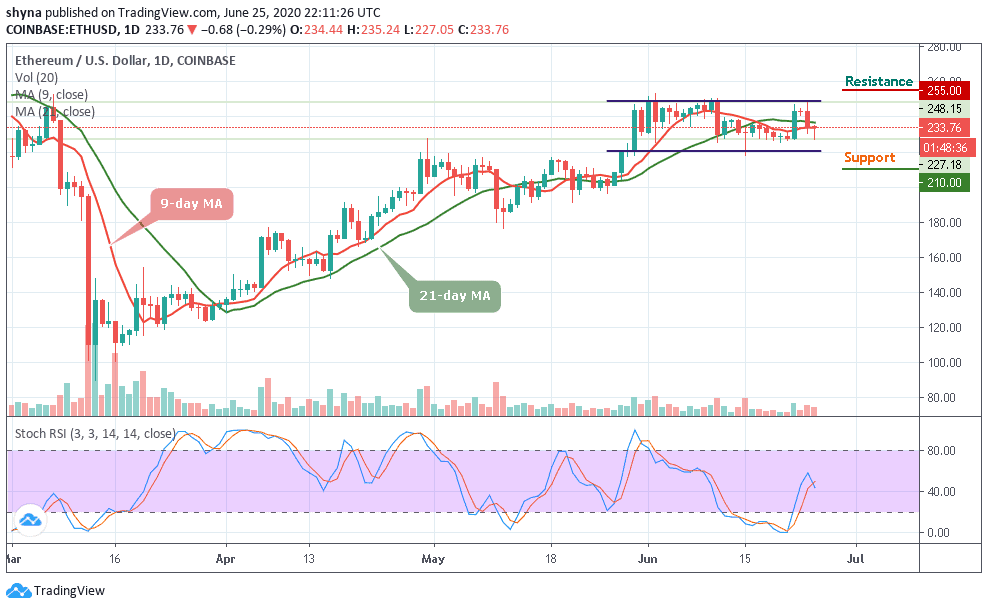
At the moment, the price to buy Ethereum with PayPal is dancing at $233 following over 0.29% losses on the day. The whole market is mainly in the red, with most cryptos having succumbed to downward pressure. Meanwhile, Ethereum’s immediate upside is limited by the 9-day moving average currently at $235. Marginally above this the pivotal level at $240 may continue to give the buyers sleepless nights.
However, a break above the upper boundary of the channel could most likely give ETH/USD a boost above $250 before reaching the important resistance at $255, $260, and $265 levels. On the downside, the stochastic RSI has a bearish feel after retreating from highs around 58-level. The first support lies at $230 this is after $235 failed to hold in the session after opening today.
Moreover, if this level is also cleared, Ethereum could revisit $220 support. Besides, the recent $217 (June 15) low is still within the reach as long as Ethereum remains under $220. More so, the critical support levels to keep eye on are $210, $205, and $200 which are below the lower boundary of the channel.
Against Bitcoin, we can see that Ethereum is clearly bearish. As the price to buy Ethereum falls, sellers are posing an additional threat for buyers to reach the support level of 0.0250 BTC where the nearest target is located. However, an eventual break below the 9-day and 21-day moving averages may cause Ethereum to collapse.
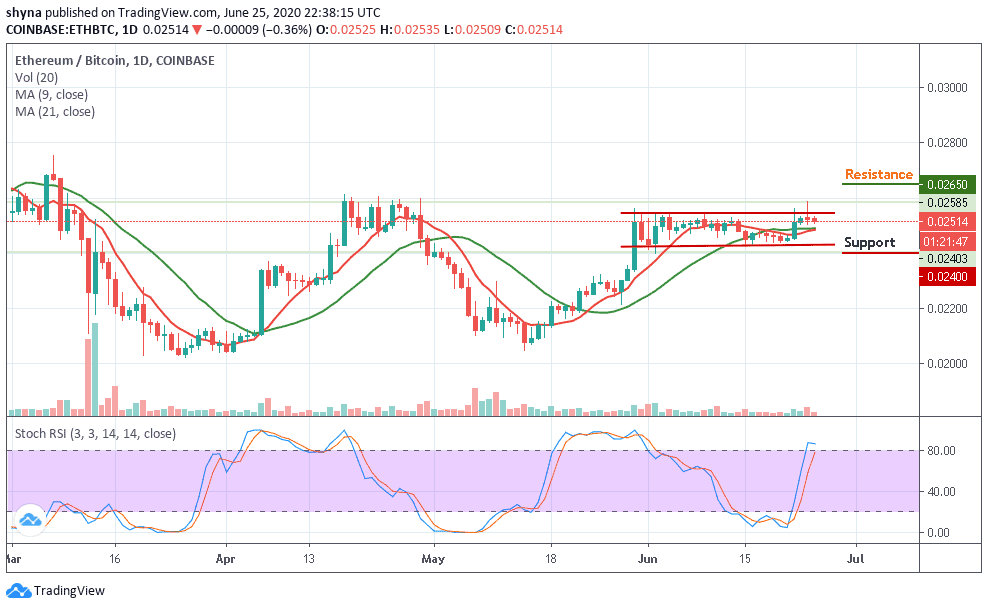
Meanwhile, the continuation of the downtrend could hit the main supports below the channel before falling to 0.0240 BTC and below. Meanwhile, a bullish trend may likely push the market to the potential resistance at 0.0265 BTC and above if a rebound plays out. The stochastic RSI is about to move into the overbought zone, indicating that the bulls may play out.
Join Our Telegram channel to stay up to date on breaking news coverage