Join Our Telegram channel to stay up to date on breaking news coverage
Bitcoin (BTC) Price Prediction – June 25
Bitcoin (BTC) price is trading nicely above the $9,300 and the coin needs to climb above the $9,500 to continue higher.
BTC/USD Long-term Trend: Bullish (Daily Chart)
Key levels:
Resistance Levels: $10,400, $10,600, $10,800
Support Levels: $8,200, $8,000, $7,800
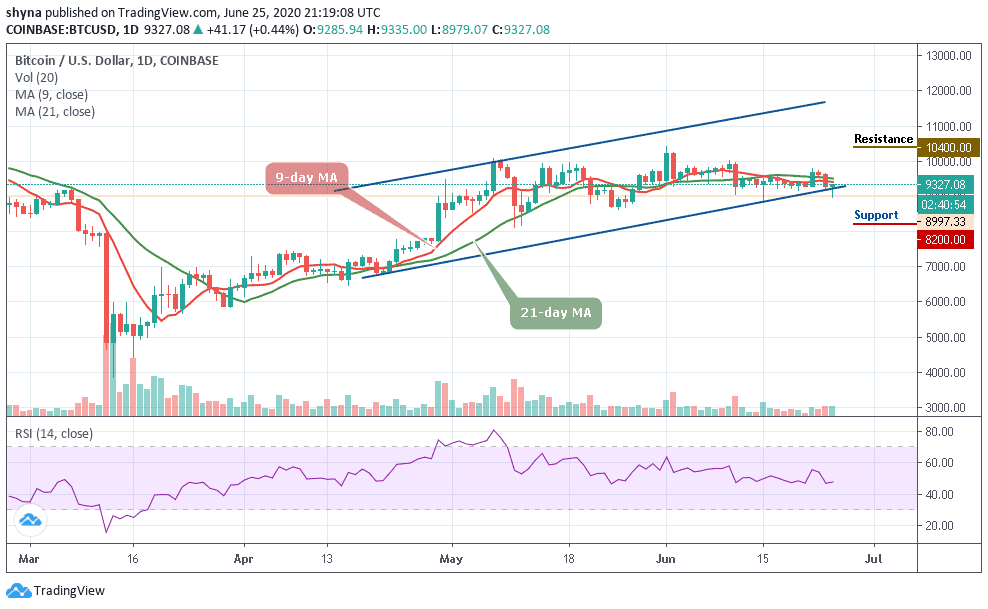
BTC/USD is seen starting the day with a downside movement as the coin touched $8,997 in the early hours of today, but later, BTC/USD market begins to improve and moving it out of the downside to the upside. However, BTC/USD is finding it difficult to climb higher above the $9,800 resistance as the coin is settling in a tight range between $9,196 and $9,682 around the lower boundary of the channel.
Typically, when the new uptrend movements are beginning to form, buyers may use the moving averages as the nearest support levels. But in as much as the above-line of 21 periods of MA is above the red-line of 9 periods MA, the market could still remain in sideways movement.
Nevertheless, if the market decides to go down, Bitcoin’s price may drop below $9,000, and should this support fails to contain the sell-off, we may see a further drop to $8,200, $8,000, and critically $7,800. The resistance levels to watch are $10,400, $10,600 and $10,800 respectively. Meanwhile, the signal line of RSI (14) is moving around 47-level, suggesting more sideways movements.
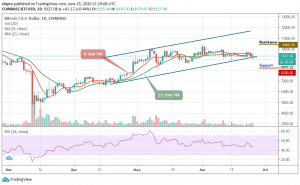
BTC/USD Medium – Term Trend: Bearish (4H Chart)
Looking at the 4-hour chart, Bitcoin’s price is currently trading around $9,304 and below the 21-day MA after rising from the daily low of $8,978 where the coin touched today. Whereas, traders can see that the bullish supply is coming up slightly in the market while the sellers are also trying to drag the price down.

However, the buyers can further push the price back to a $9,500 resistance level. Therefore, breaking the mentioned resistance could also allow the bulls to test the $9,600 and above. Meanwhile, the market is indecisive as the RSI (14) indicator moves around 45-level, but any further movement below the lower boundary of the channel may reach the support level of $9,000 and below.
Join Our Telegram channel to stay up to date on breaking news coverage