

Join Our Telegram channel to stay up to date on breaking news coverage
ETH Price Prediction – March 25
The Ethereum price may face a fresh round of selling as the price remains at a risk of more downsides if it breaks the $130 support zone.
ETH/USD Market
Key Levels:
Resistance levels: $165, $170, $175
Support levels: $105, $100, $95
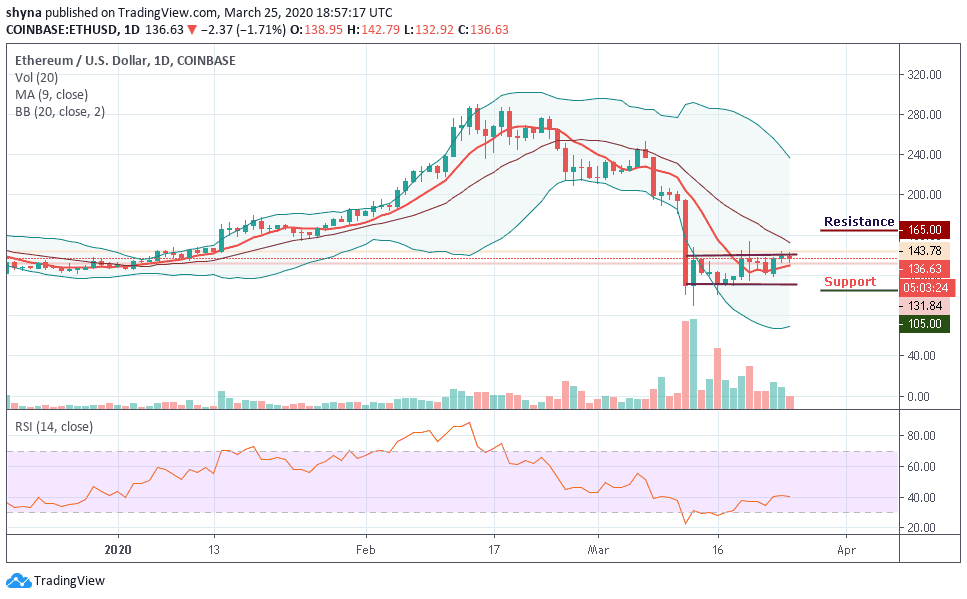
For quite some time now, ETH/USD had been stuck around the trading price area of $110 and $140, after falling from $143 and then $140 price levels. A couple of days ago, ETH/USD price was found around its usual resistance level where it rose to the $143.78. Towards the day-end, ETH mounted high and just to start plunging today.
However, ETH/USD is currently trading above the 9-day moving average at $136.63 at the time of writing, having trying to recover from the intraday low of $131.84. The second-largest crypto, with a current market value of $15.05 billion, has lost 1.71% of its value since the beginning of today and has remained above the moving average.
Similarly, the Ethereum price continues to follow the sideways movement but still within the channel and any attempt to break below the channel, the bears may see the critical support at $105, $100 and $95 levels. In other words, if the bulls push the price above the channel and maintain the upward movement within the channel, the buyers may likely find resistance at $165, $170 and $175.
Meanwhile, the RSI (14) is moving in the same direction, which indicates that the market is indecisive now.
Against Bitcoin, the market price remained in the descending channel as the bears are dominating the market. ETH/BTC is currently trading at 0.0204 BTC and the bulls couldn’t push the price above the 9-day moving average. Looking at the chart, if the market continues to drop, the next key supports may likely be at 0.0180 BTC and below.
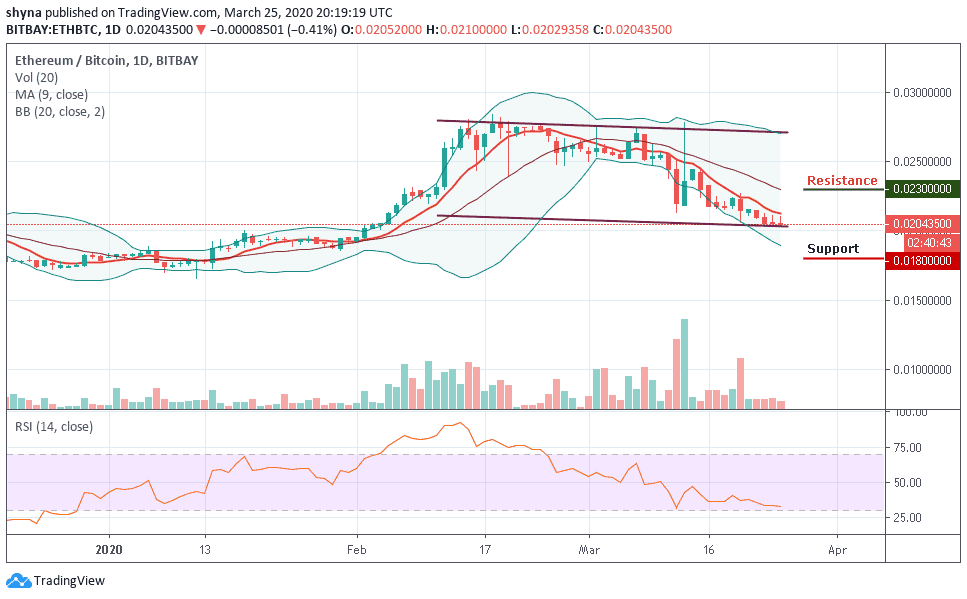
However, on the upside, a possible bullish movement may likely push the market above the moving average, when this is done, the resistance level of 0.0230 BTC and above could be visited. The RSI (14) faces the south and this indicates that the market may continue to fall.
Please note: Insidebitcoins.com is not a financial advisor. Do your research before investing your funds in any financial asset or presented product or event. We are not responsible for your investing results.
Join Our Telegram channel to stay up to date on breaking news coverage
