Join Our Telegram channel to stay up to date on breaking news coverage
Ethereum Price Prediction – February 21
There has been a persistent visible increase in the valuation of ETH/USD trading operations over a sizeable number of trading sessions. The increasing mode appears to be in a light manner so far that a bit lacks intense volatility.
ETH/USD Market
Key Levels:
Resistance levels: $2,200, $2,400, $2,600
Support levels: $1,600, $1,400, $1,200
ETH/USD – Daily Chart
As shown by the daily trading chart, variant ups and downs have characterized the formation of series of candlesticks formed on the buy signal line of the SMA trading indicators. Another set of candlesticks are being formed around a high value of $2,000 line with the 14-day SMA trend-line placed a bit over $1,600 below. Meanwhile, the 50-day SMA is underneath the smaller SMA a bit over the immediate support level at the $1,600 mark. The Stochastic Oscillators have penetrated the overbought region to seemingly resume a consolidation move. That signifies that more pressures are still potentially imminent.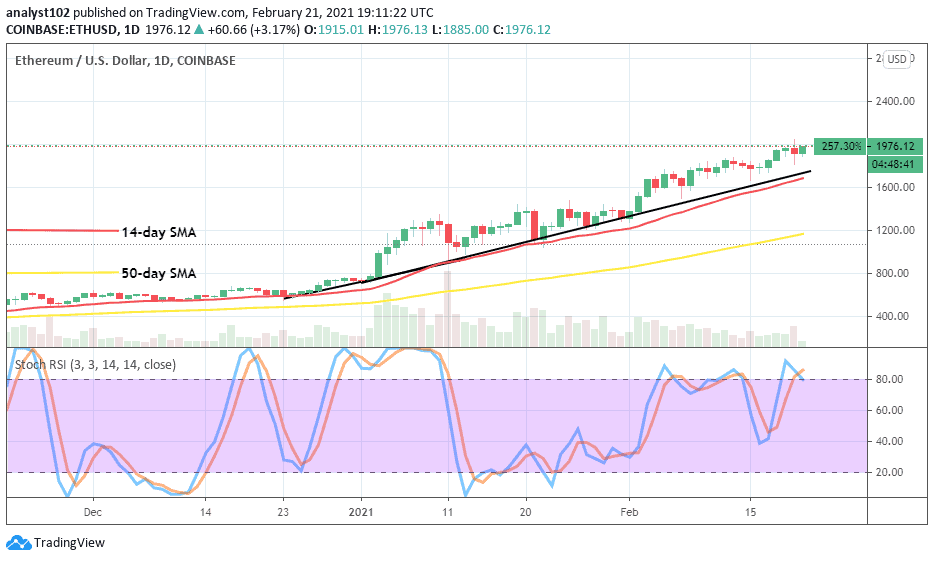
Will, there be more price-soars in the ETH/USD next trading sessions?
It is being a basic fact that the ETH/USD market trading stance has consistently been on an increase over some trading weeks running into some months now. Bulls’ forces have prevailed strongly over any attempted falling pressures by bears in the crypto-trade mostly while price pushes southward towards only to find support before the trend-line of the 14-day SMA indicator. That said, the main support levels for the current uptrend are around $1,800 and $1,600.
Key resistance is built up between $2,000 and $2,200 price levels. Expectantly, the ETH/USD bears may have the market’s advantage to make a stand as opposed to the continuation of the current bullish trend for a while. However, should a violent bullish reversal take place around those trading zones, that could eventually lead to creating a decent selling wall in the long run.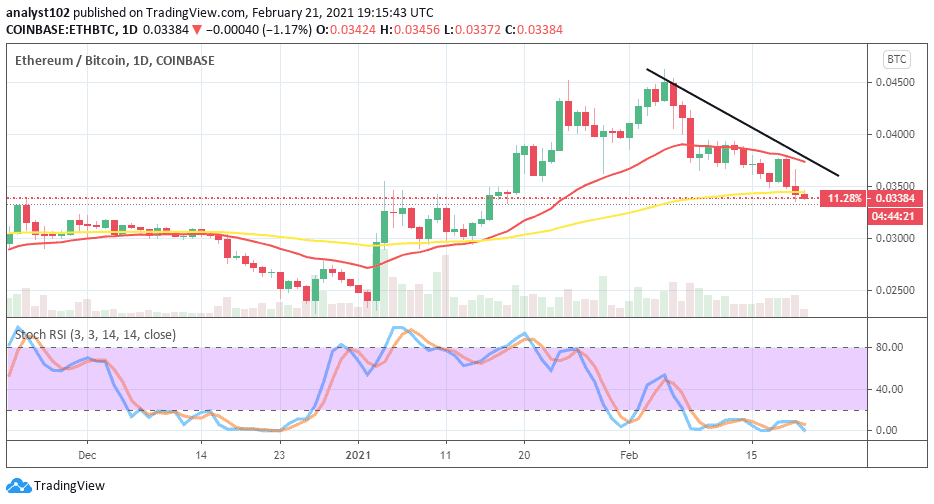
ETH/BTC Price Analysis
Juxtaposing the price-strength of ETH with BTC, Ethereum has been under a kind of sell-offs as paired with the flagship crypto almost complete two weeks ago. The trading chart attests that both the two SMA trend-lines have breached southward past. That indicates that the crypto-base is getting weaker presently. The 14-day SMA is a bit bent south-way over the 50-day SMA to showcase ongoing falling pressures in the crypto-pairs. The Stochastic Oscillators are dipped into the oversold region to consolidate within it. That represents a trading technical myth in line with the possibility of not seeing the crypto-base getting a rebound on a quick note.
Join Our Telegram channel to stay up to date on breaking news coverage