Join Our Telegram channel to stay up to date on breaking news coverage
Bitcoin Price Prediction – February 21
tI is apparent that a lot of significant buying pressures have continued to play a dominant role in the trade between BTC and the US Dollar after a successful northward-break of $50,000 resistance point over the last couple of trading days’ sessions until the present time of writing.
BTC/USD Market
Key Levels:
Resistance levels: $60,000, $65,000, $70,000,
Support levels: $45,000, $40,000, $35,000
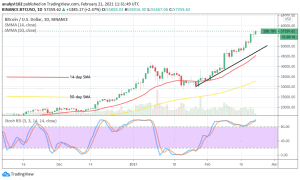
BTC/USD – Daily Chart
The daily trading chart shows the crypto-market yet continually respects more up-moves on the buying signal signs of both of the two SMA trend-lines. A sudden emergence candlestick spike on February 17 against resistance around $50,000, has led the crypto’s worth-level making a clear stride averaging a key resistance of $60,000 currently. The 14-day SMA is above the 50-day SMA with a space between them as they both point to the north underneath the current market trading zone. The Stochastic Oscillators are dipped into the overbought region to continually consolidate within it. That’s a signal that some degree of buying forces are still ongoing.
Will the value of BTC/USD prolong pushing northbound further?
Going by the current market strength being put up by the chief ever cryptocurrency, it is most likely that the BTC/USD’s journey to the north hasn’t yet exhausted especially, as price waxing stronger toward the immediate resistance at $60,000. In the meantime, a retracement move may occur around the levels of $55,000 and $50,000 where bulls could get repositioned for better support of prolongation of the current bullish trend.
On the flip side, the BTC/USD bears have to mount a resistance block around the $60,000 and the $65,000 price levels to douse the present buying mode in the crypto-economy. Failure to get theirs stand around those areas, they may have to wait for a touch or a reversal move around the $70,000 resistance level couple with a formation of one-full bearish candlestick at least around the two price levels mentioned in this technical write-up paragraph.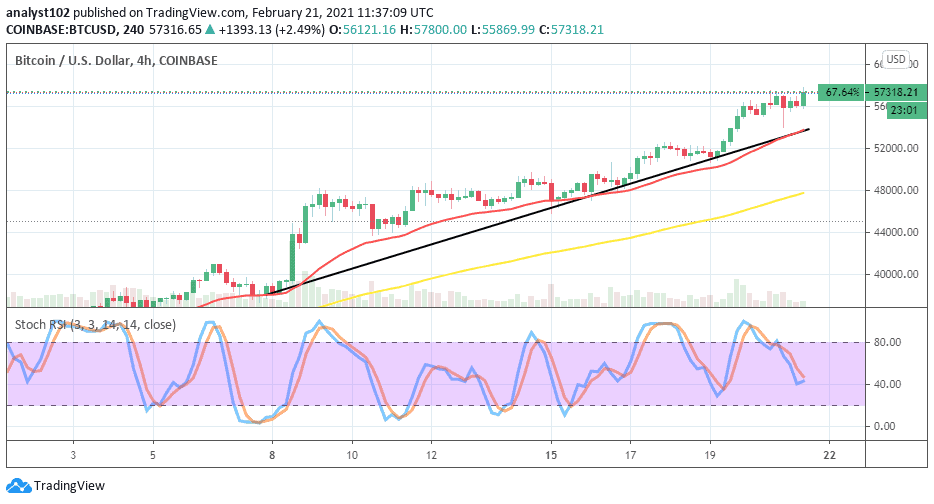
BTC/USD 4-hour Chart
The 4hour trading chart depicted the crypto’s value as domineering trade of around $57,000 against the US dollar’s as at the time of writing. Over a short time, BTC encountered a difficult point around $52,000 before breaking northward past it. Like wisely.\, the 14-day SMA and the 50-day SMA trend-lines are both pointing to the northward below the market trading price. That clearly shows that the buying spree is ongoing. The Stochastic Oscillators are now seemingly attempting to cross the hairs at range 40 to the north. That could mean that the BTC/USD bulls may push further northward to achieve a new all-time high value of around $60,000 or even beyond in a near trading session.
Join Our Telegram channel to stay up to date on breaking news coverage