Join Our Telegram channel to stay up to date on breaking news coverage
ETH Price Prediction – May 27
The Ethereum (ETH) has switched on recovery mode and it may move past $210 before the end of this week.
ETH/USD Market
Key Levels:
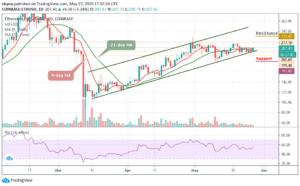
Resistance levels: $230, $240, $250
Support levels: $180, $170, $160
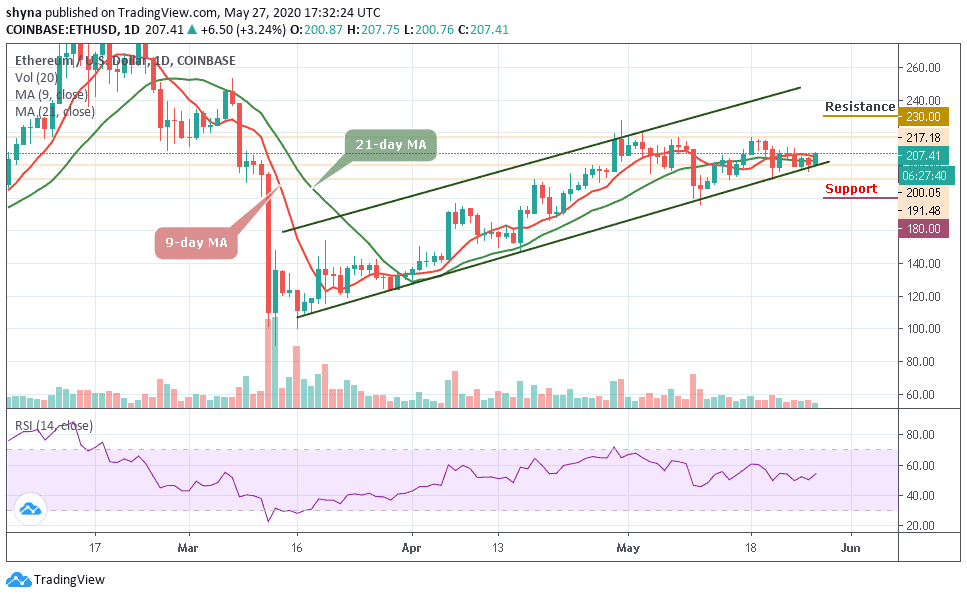
This is a good time for Ethereum holders as ETH/USD is starting to show a few signs of improvement and is likely to begin to trade above $210 very soon. The current performance of the coin in the market also indicates the continuation of an uptrend and traders must therefore closely monitor this coin very well.
However, the highest value Ethereum has had in the last 15 days was $217.18 and in the last 7 days, it has gone down to $191.48. ETH can be expected to rise from $200 to $230 before the end of this month. The on-going trend may move a little bit higher this week as the coin crosses the 9-day and 21-day moving averages to touch the nearest resistance at $210.
More so, if the bulls put more effort, the price could hit additional resistance levels at $230, $240, and $250 respectively. Meanwhile, the support levels to watch are $180, $170, and $160. The RSI (14) indicator is seen moving above 54-level, any cross above the 60-level may confirm the bullish movement.
Against Bitcoin, the price formed a bullish trend on the chart and it is above the 9-day and 21-day moving averages consolidating. The bulls are still pushing the price upward today but if they are able to maintain the trends, the price may likely hit the resistance levels at 0.028 BTC and above.
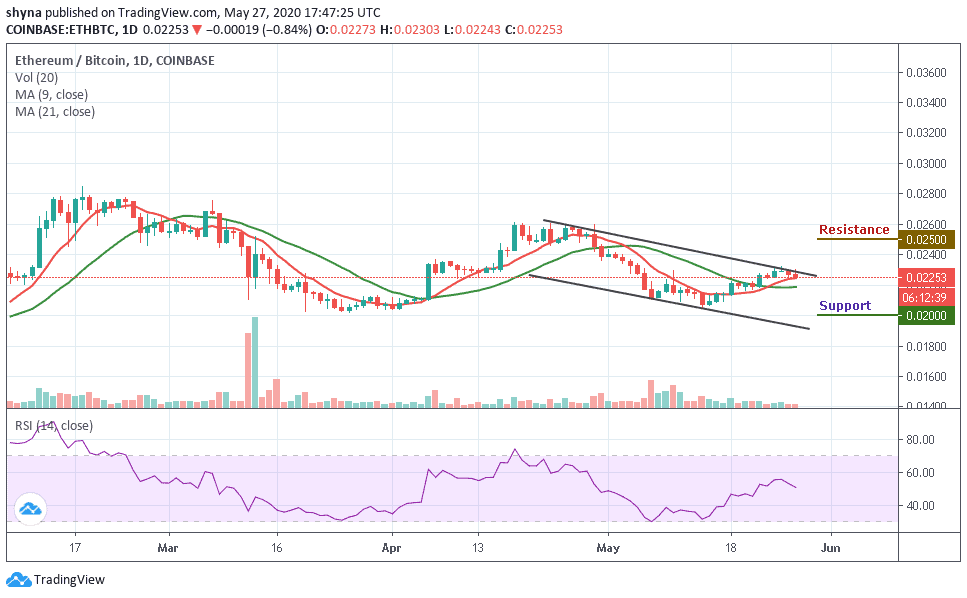
Moreover, Ethereum has been trending within the channel and it may likely break out of the channel but any retracement could bring the price to the nearest support level and this may reach the major support level of 2000 SAT and below. Nevertheless, the technical indicator RSI (14) nosedives to the south, which may push the price below the moving averages.
Please note: Insidebitcoins.com is not a financial advisor. Do your research before investing your funds in any financial asset or presented product or event. We are not responsible for your investing results.
Join Our Telegram channel to stay up to date on breaking news coverage