Join Our Telegram channel to stay up to date on breaking news coverage
ETH Price Prediction – August 9
ETH/USD path of least resistance is downwards but support is anticipated at $390.
ETH/USD Market
Key Levels:
Resistance levels: $440, $460, $480
Support levels: $350, $330, $310

ETH/USD for the first time this year made it above $400 even beating the last year high around $361. A new yearly high was formed at $415.09 but marked the end of the magnificent bullish move. Due to high volatility witnessed at the beginning of this month, a reversal took place sending the coin back to the support at $325.86.
Since the beginning of last week, ETH/USD has remained in the bullish hands but the price action has not been as rapid as seen in the last couple of weeks of July. Attempts to sustain gains above $400 have not yielded with Ethereum remaining pivotal at the same level.
What is Next for Ethereum (ETH)?
In the meantime, ETH/USD is trading at $390.22 amid consolidation. The immediate upside is capped by the increasing seller congestion at $400. A glance at the technical indicator shows that ETH/USD is poised for continued downward action. For instance, the RSI (14) is moving out of the overbought region, which may increase the dominance of the sellers in the market. The critical supports are located at $350, $330, and $310 respectively.
For now, the best the bulls can do is to establish support above $390 if not $395 so that this could allow for consolidation in a narrow range and push for gains above $400. More so, the action above $400 would encourage more buying entries as the bulls push the price towards $440, $460, and $480 resistance levels.
Against BTC, ETH has been experiencing a slight difficulty since a few days ago. The coin recently breaks under solid support at 3350 SAT and continued to fall below the 9-day MA. The critical support level is 3000 SAT and below.
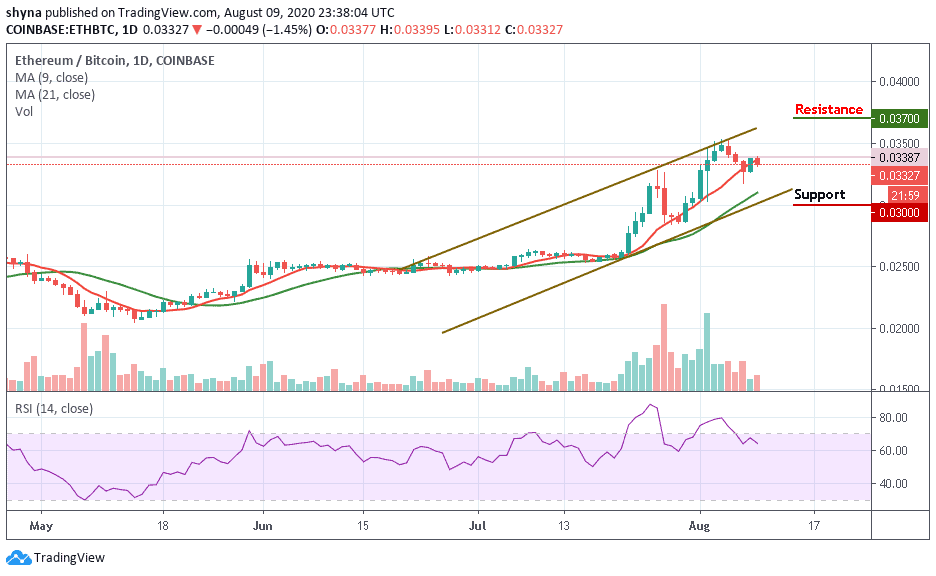
However, if the bulls continue to power the market, we may soon find the resistance level at 3700 SAT and above. At the moment, the RSI (14) is facing downward from the overbought zone, which indicates more bearish signals.
Join Our Telegram channel to stay up to date on breaking news coverage