Join Our Telegram channel to stay up to date on breaking news coverage
Bitcoin (BTC) Price Prediction – August 9
Today’s price pullback has affected the majority of altcoins within the market.
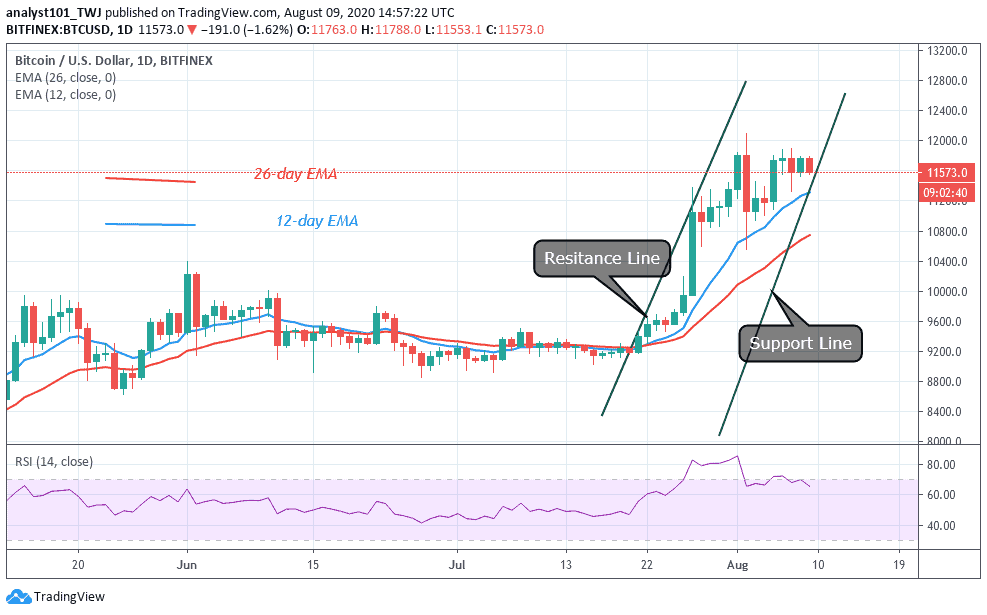
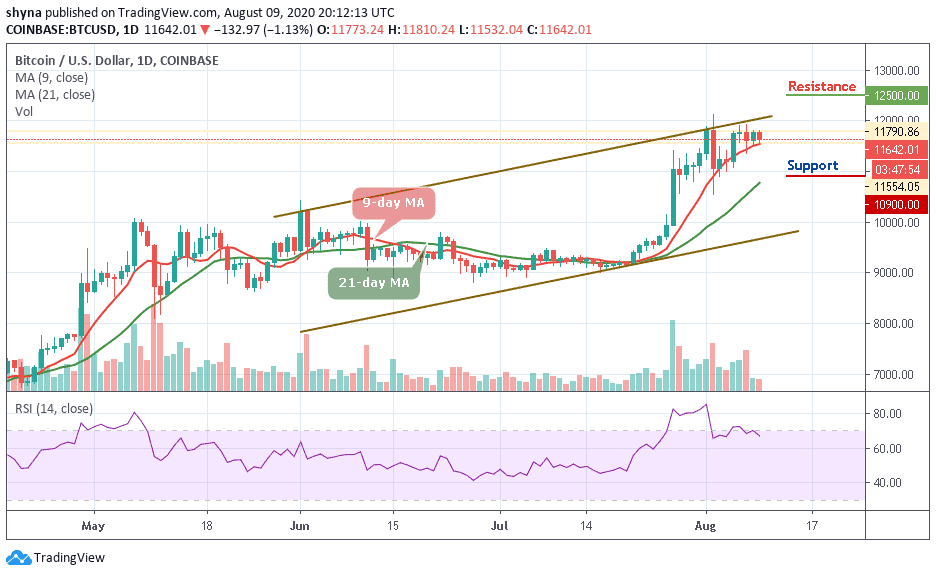
BTC/USD Long-term Trend: Bullish (Daily Chart)
Key levels:
Resistance Levels: $12,500, $12,700, $12,900
Support Levels: $10,900, $10,700, $10,500
BTC/USD bears continue to lurk above the $11,700 level, limiting the upbeat momentum in the spot so far today. The first digital asset consolidates yesterday’s rebound around $11771, almost unchanged on the day, at the time of writing. The selling pressure in this zone proved to be insurmountable in the last few days. However, this consolidation could be coming to an end according to derivatives data indicating that the king coin might soon climb higher.
Would Bitcoin (BTC) Go up or Down?
At the time of writing, BTC is changing hands at $11,642, which marks a significant rally above a critical support level at $11.500. However, where BTC trends next may partly depend on whether or not buyers can close today’s candle above the $11,700 level. Should in case this comes to play, it may propel prices higher. And we expect BTC/USD to rise above $12,000 resistance which could later move towards the potential resistance levels at $12,500, $12,700, and $12,900.
In other words, if the Bitcoin price failed to close above $11,700 resistance level; the price could drop below the 9-day MA. A further low drive could send the price to $10,900, $10,700, and $10,500 supports. The technical indicator RSI (14) has recently revealed a sign of trend reversal, which shows a possible bearish momentum, could play out.
BTC/USD Medium – Term Trend: Bullish (4H Chart)
On the 4-hour chart, BTC/USD is currently trading around $11,680 under the 9 and 21 periods MA after a reversal from $11,774 where the market started trading today. At the moment, we can see that the bullish supply is coming up slowly in the market while the bears are also trying to drag the price down.
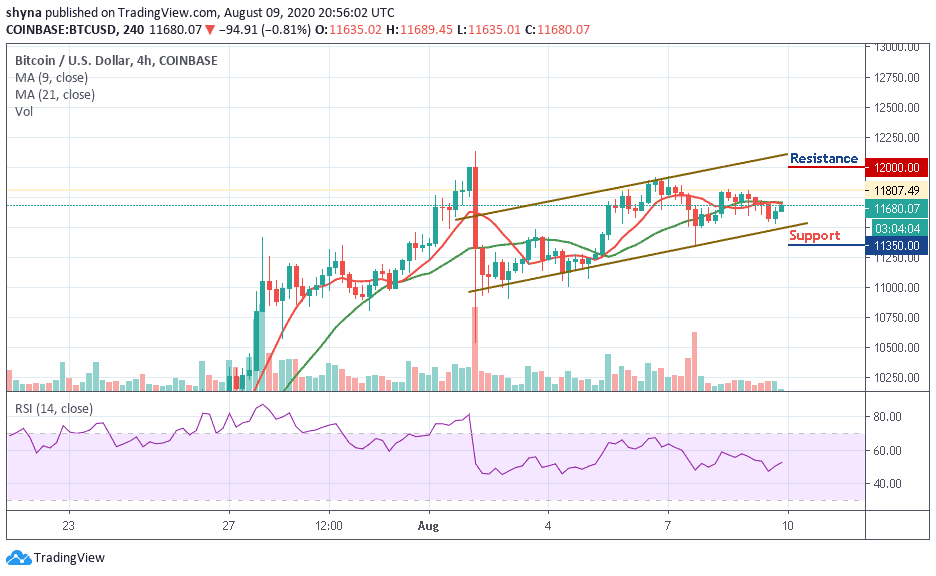
If the buyers could strengthen and energize the market, they can further push the price above the moving averages and this could allow the market price to test the $12,000 and above. The RSI (14) is currently moving above 50-level, but any movement to the south may drag the price to the support level of $11,350 and below.
Join Our Telegram channel to stay up to date on breaking news coverage