Join Our Telegram channel to stay up to date on breaking news coverage
Bitcoin (BTC) Price Prediction – August 9, 2020
BTC/USD has continued its consolidation as the market reaches a tight range. Initially, BTC was consolidating between $11,000 and $12,000. Presently, it is trading in a tight range between $11,600 and $12,000. Nonetheless, as bulls and bears continued the price tussle, a breakout is likely on the upside.
Resistance Levels: $10,000, $11, 000, $12,000
Support Levels: $7,000, $6,000, $5,000
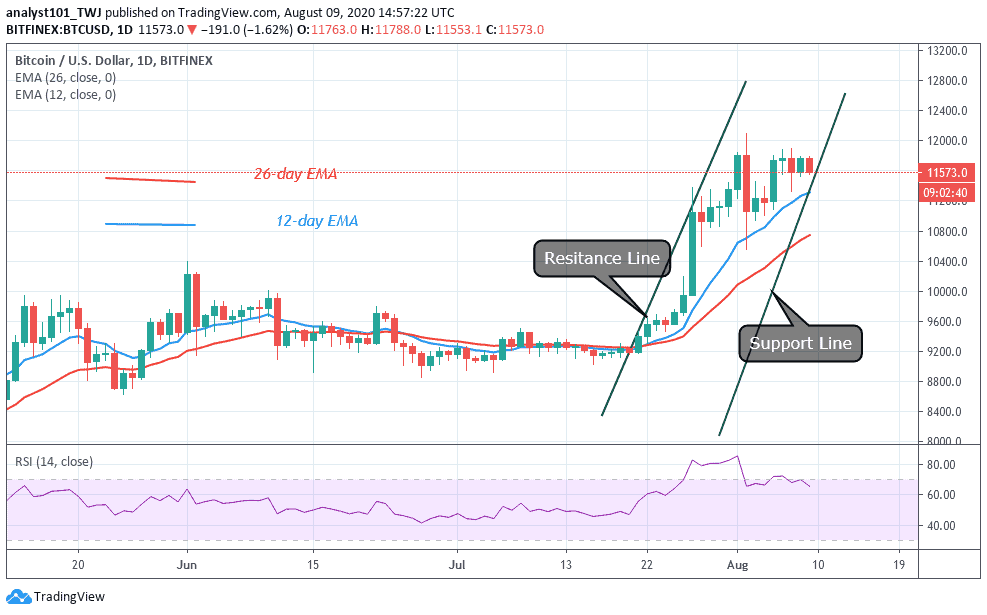
Yesterday, buyers retested the $12,000 resistance zone twice but were repelled. Buyers are not reaching the $12,000 price level. The king coin has been facing rejection at the $11,800 resistance since August 5. Analysts believe that once the $12,000 resistance is breached; a further upward move will unfold. It has been indicated that BTC is facing its major resistance at the recent high. A breakout will propel the coin to a high of $15,000 and above.
Conversely, if the bulls fail to break the overhead resistance, Bitcoin will be compelled to an indefinite range-bound movement below the resistance. Meanwhile, Bitcoin is falling after the resistance at $11800 as price reaches the low of $11,600. BTC is at level 67 of the Relative Strength Index period 14. It indicates that the market is trading in the uptrend.
Bitcoin Market Capitalization Is Comparable to Bank of America
With the impressive move of Bitcoin in 2020, market capitalization has risen and is comparable to Bank of America. According to reports, Bitcoin current valuation is over $215 billion; while Yahoo Finance indicated that Bank of America’s current valuation is slightly above $226 billion. Nevertheless, speculative capital investments are totaling a few billion dollars besides the current valuation of Bitcoin.
BTC/USD Next Possible Direction
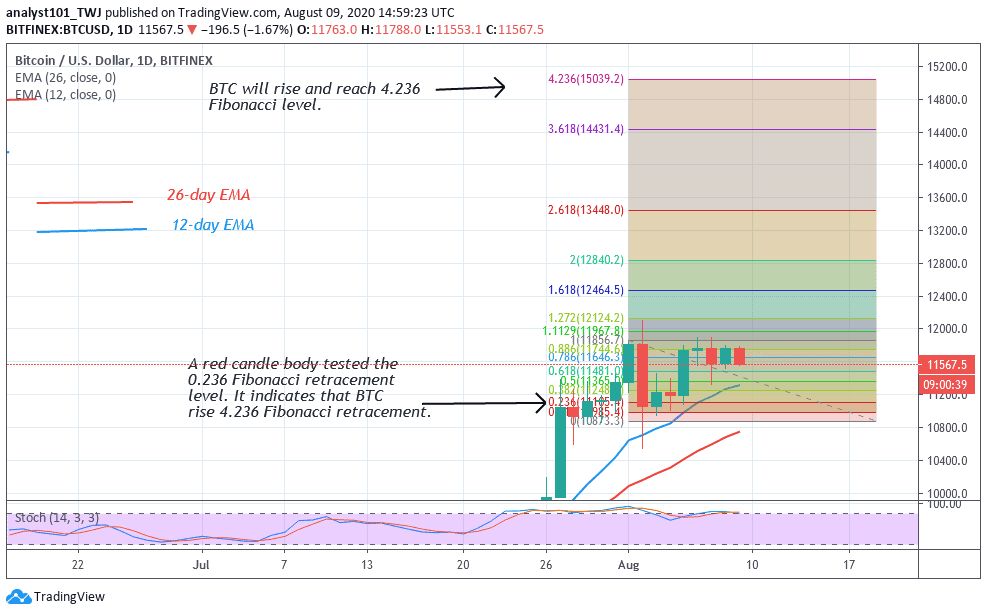
For the past week, Bitcoin has been fluctuating between $11,000 and $12,000 and unable to break the $12,000 overhead resistance. Nevertheless, from the August 1 uptrend, a red candle body tested the 0.236 Fibonacci retracement level. This candlestick explains that BTC will rise to 4.236 extension level. In other words, BTC will rally to $15,000 high.
Join Our Telegram channel to stay up to date on breaking news coverage