Join Our Telegram channel to stay up to date on breaking news coverage
BCH Price Prediction – August 9
For now, BCH/USD is mainly in the hands of the bulls as they eye action towards the $310 resistance level.
BCH/USD Market
Key Levels:
Resistance levels: $338, $348, $358
Support levels: $278, $268, $258

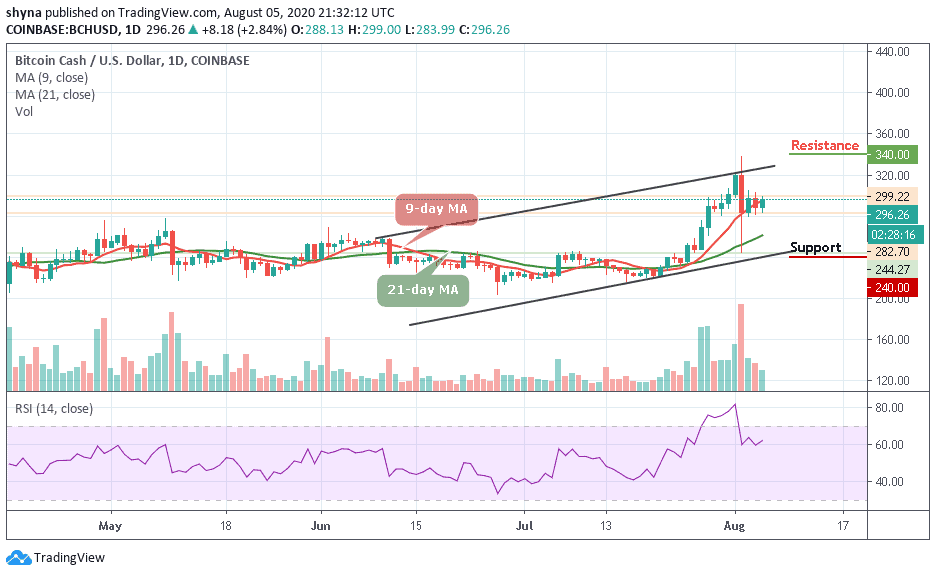
BCH/USD buyers are extending the price action above $305 as the coin hovers at $307.75 at the time of writing following a consistent bullish action since August 3. Meanwhile, all indicators have aligned for a perfect bullish storm, starting with the 9-day MA flying above the longer-term 21-day MA. Besides function as key support areas, the widening gap between the moving averages emphasizes the bullish momentum building in the market. The RSI (14) is also on an upward roll facing the overbought region.
What Traders Should Expect From Bitcoin Cash (BCH)
BCH/USD is currently trading above 9-day and 21-day moving averages, the market price is expected to rise towards the $310 level if the technical picture remains intact in the near term, gains eyeing $330 could also start to materialize. It is also essential that bulls establish support above $305 to ensure that progress made above $300 is not wasted. This could also give them a fighting chance for levels above $320 and $330 in the short term.
Nevertheless, the next resistance is located at around $325. Once it is out of the way, the upside is likely to gain traction with the next focus on psychological $338, $348, and $358 resistance levels. Considering that the price regained ground above at 9-day MA at $305, the bullish scenario looks credible at this stage. On the downside, the correction may be extended to $290. If it is broken, the green-line of 21-day MA at $278 may come into focus. Once it is out of the way, the sell-off may be extended towards $258 and $238 supports.
Against BTC, if the bulls succeeded in breaking above the 9-day moving average, the market price may likely reach the next resistance level of 2700 SAT and 2750 SAT.
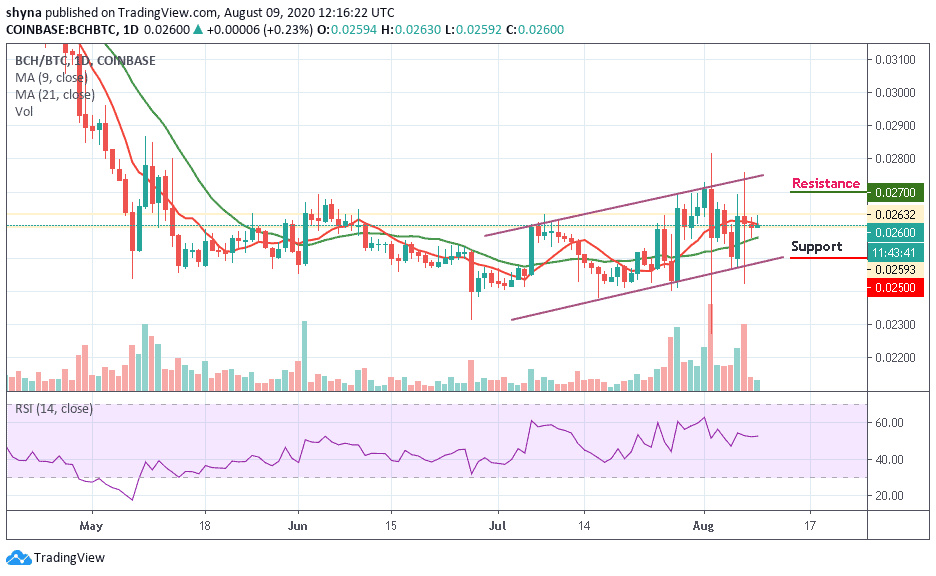
In other words, a retest could allow the pair to go below the 9-day and 21-day moving averages and lower the price to 2500 SAT and 2450 SAT support levels. At the moment, the RSI (14) is moving in the same direction, suggesting sideways movement for the coin.
Join Our Telegram channel to stay up to date on breaking news coverage