Join Our Telegram channel to stay up to date on breaking news coverage
ETH Price Prediction – June 14
The price to buy Ethereum surges from $239 to $234 within 24 hours but it may trade below $230 in the coming week.
ETH/USD Market
Key Levels:
Resistance levels: $255, $265, $275
Support levels: $220, $210 $200
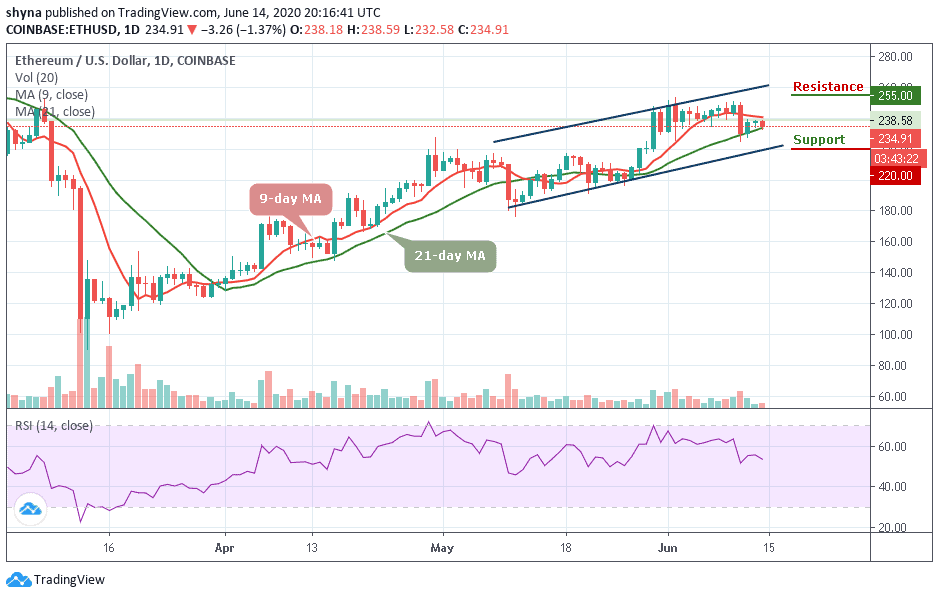
Today, if you Buy Ethereum with PayPal you’ll notice it is facing a small price decline and it is currently trading at $234.91. The cryptocurrency continues to be supported at the $200 level but it seems that the bears are adamant to push the coin lower as it is losing around 1.37% within 24 hours.
However, at the time of writing, ETH/USD keeps trending in red within the ascending channel, trading within the 9-day and 21-day moving averages. After the opening of the market, the daily price chart shows that ETH/USD fell from $238.58 to $232.75, where it found short-term support and now bouncing to $234.91, where it is currently trading.
Moreover, for a backward movement, the market can be supported at $220 and $210 levels, if the price falls below the previous levels; another support is around $200. But should in case the price exceeds the indicated level by moving above the moving averages, then, the resistance levels of $255, $265 and $275 may be visited. Meanwhile, the RSI (14) nosedives below 55-level, which may likely give more bearish signals.
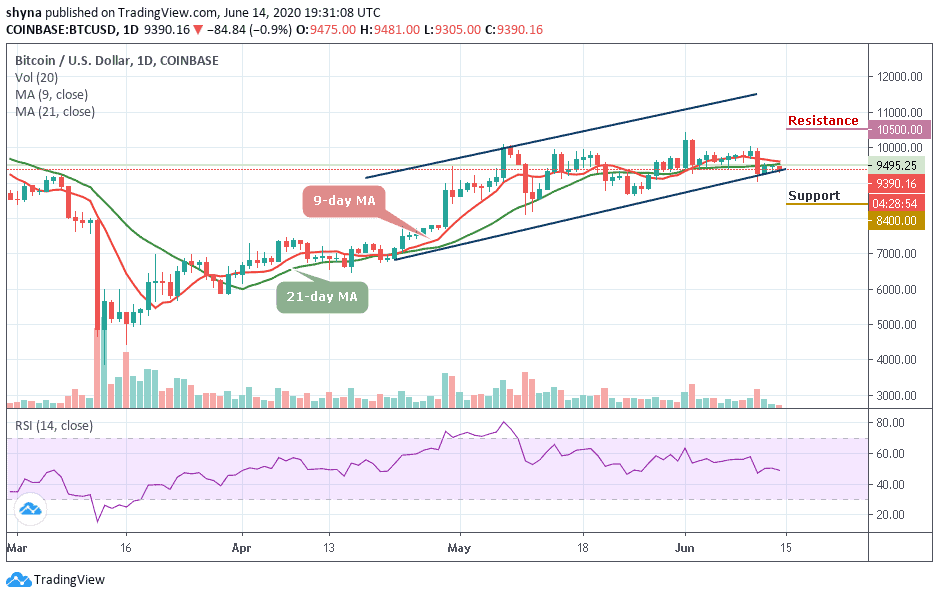
Against Bitcoin, the market price remained in the ascending channel but the bears are trying to step back into the market. ETH/BTC is currently trading at 0.0249 BTC and the bulls couldn’t push the price to cross the 9-day MA. Looking at the daily chart, if the market continues to drop, the next key supports may likely be at 0.0230 BTC and below.

However, on the upside, a possible bullish movement may likely push the market across the channel, when this is done, the resistance level of 0.0270 BTC and above could be visited. The RSI (14) nosedives to the south, which indicates that the market may continue to fall.
Please note: Insidebitcoins.com is not a financial advisor. Do your research before investing your funds in any financial asset or presented product or event. We are not responsible for your investing results.
Join Our Telegram channel to stay up to date on breaking news coverage