Join Our Telegram channel to stay up to date on breaking news coverage
Bitcoin (BTC) Price Prediction – June 14
Today, BTC/USD faced a pullback as the price slid below $9,300 and tested support near $9,297 price area.
BTC/USD Long-term Trend: Bullish (Daily Chart)
Key levels:
Resistance Levels: $10,500, $10,700, $10,900
Support Levels: $8,400, $8,200, $8,000
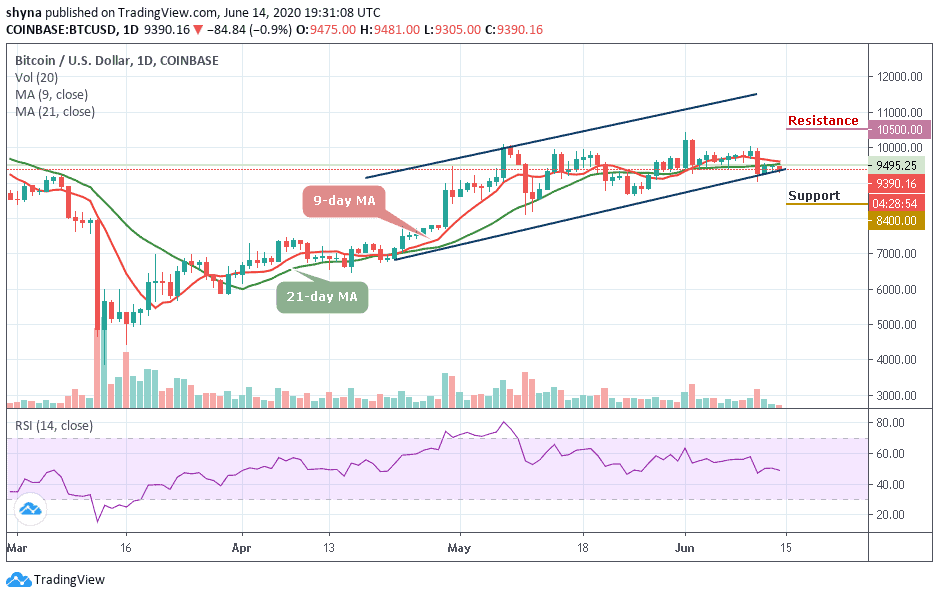
Since a few days ago, BTC/USD has not been able to breach the $10,000 resistance level following a recent rejection at $10,032. On the downside, support has been established at $9,300. BTC/USD is trading at $9,390 at the time of writing. The prevailing trend is having a bearish bias but the bullish interest has not left the market in spite of the resistance at $10,000.
However, the market is deciding below the 9-day and 21-day moving averages, where the buyers are anticipating a clear break down below the channel. More so, if the green-line of 21-day MA crosses above the red-line of 9-day MA, the market may experience more downtrends. Nevertheless, should the $9,500 level holds, the $9,800 and $10,000 levels may further surface as potential resistances where a strong bullish spike might take the price to the resistance levels of $10,500, $10,700, and $10,900.
Moreover, if the market continues to follow the downward trend, the price of Bitcoin may drop to $9,000, and should this support fails to contain sell-off, we may see a further roll back to $8,400, $8,200, and $8,000 support levels. Meanwhile, the technical indicator RSI (14) is facing down, the market may fall to immediate supports.
BTC/USD Medium – Term Trend: Raging (4H Chart)
On the 4-hour chat, Bitcoin bears are stepping back into the market, pushing the price below the 9-day and 21-day moving averages around $9,366. Although, the Bitcoin price has not yet slipped below $9,000 support level as the coin is still in the loop of making a bounce back at its price hovers around $9,396 which may take time to persistently trade above $10,000.
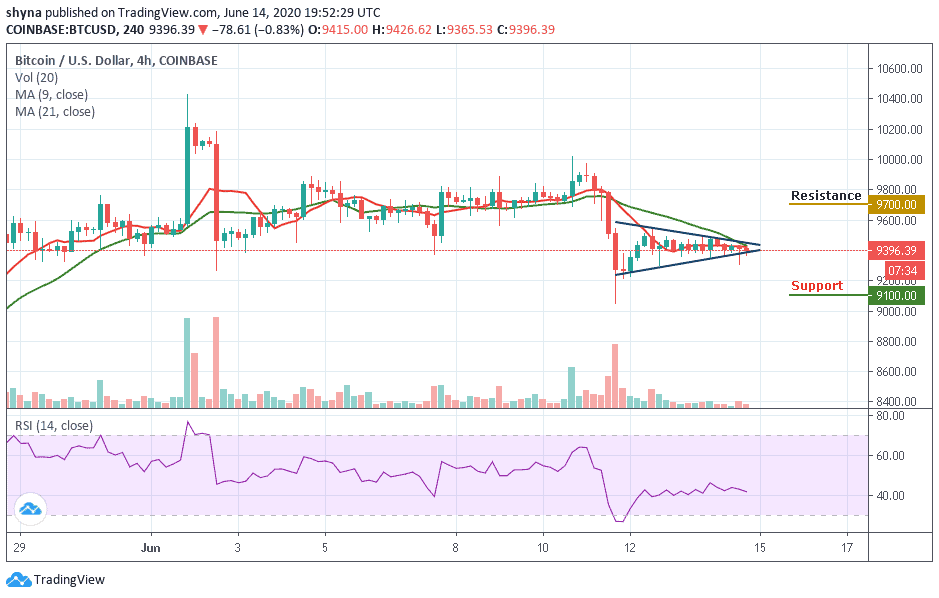
At the moment, BTC/USD is making an attempt to cross below the lower boundary of the channel as the technical indicator RSI (14) is moving above 40-level. If it crosses below 40-level, the coin could resume a bearish movement which may likely drag the Bitcoin price to the nearest supports at $9,100, $8,900 and $8,700 while the potential resistance lies at $9,700, $9,900 and $10,100.
Please note: Insidebitcoins.com is not a financial advisor. Do your research before investing your funds in any financial asset or presented product or event. We are not responsible for your investing results.
Join Our Telegram channel to stay up to date on breaking news coverage