Join Our Telegram channel to stay up to date on breaking news coverage
ETH Price Prediction – May 19
After Ethereum (ETH) breaks above $215, a stronger retest of previous resistance is expected.
ETH/USD Market
Key Levels:
Resistance levels: $240, $245, $250
Support levels: $180, $175, $170
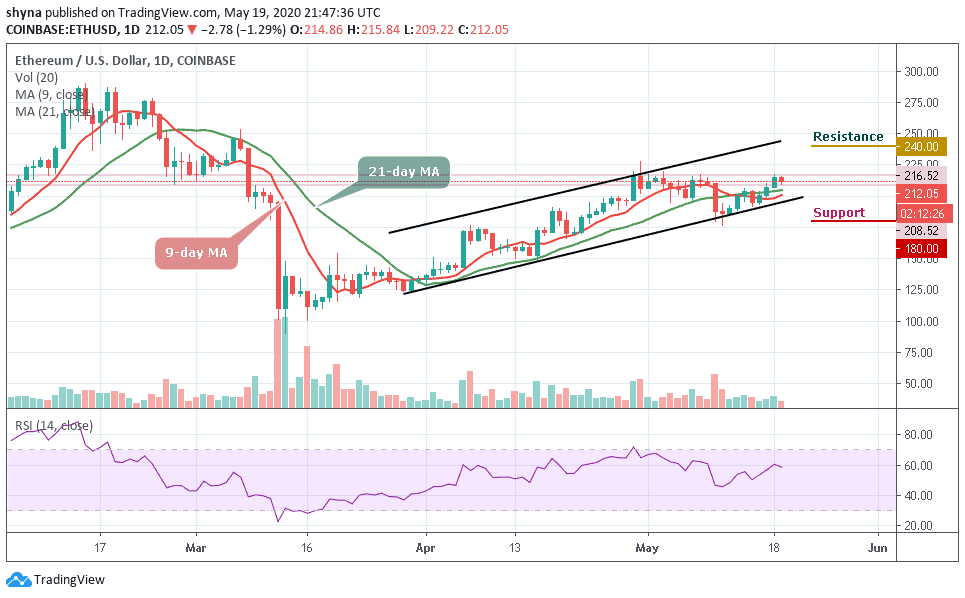
ETH/USD bulls are intentional about finding higher support for the coin. This battle comes after ETH/USD tried and failed to extend gains past $216 which happens to be the daily high as at the time of writing. Ethereum price is back under $215 and currently exchanging hands at $212.06. Moreover, ETH/USD is moving above the 9-day and 21-day moving averages.
Furthermore, as long as the 9-day MA remains below the 21-day MA, traders can expect ETH to consolidate at lower levels. That’s if we could see a further drop below the $205 which is fast approaching; it may likely reach the supports at $180, $175, and $170. Meanwhile, the potential resistance levels to watch for lie at $240, $245, and $250 respectively.
Currently, the buy Ethereum price follows a dominant bullish bias but looking at the technical indicator RSI (14) displays a positive picture of the coin in the near-term. Moreover, by maintaining a gradual upward slope within the positive region, the RSI (14) must remain above the 60-level within the positive region.
When compared with Bitcoin, the daily chart reveals that the bulls are making effort to step back into the market and the coin is making an attempt to show some promising signs that could make lower highs if the price moves above the 9-day and 21-day moving averages. On the upside, the nearest level of resistance lies at 0.024 BTC and above this, higher resistance lies at 0.026 BTC and 0.028 BTC.
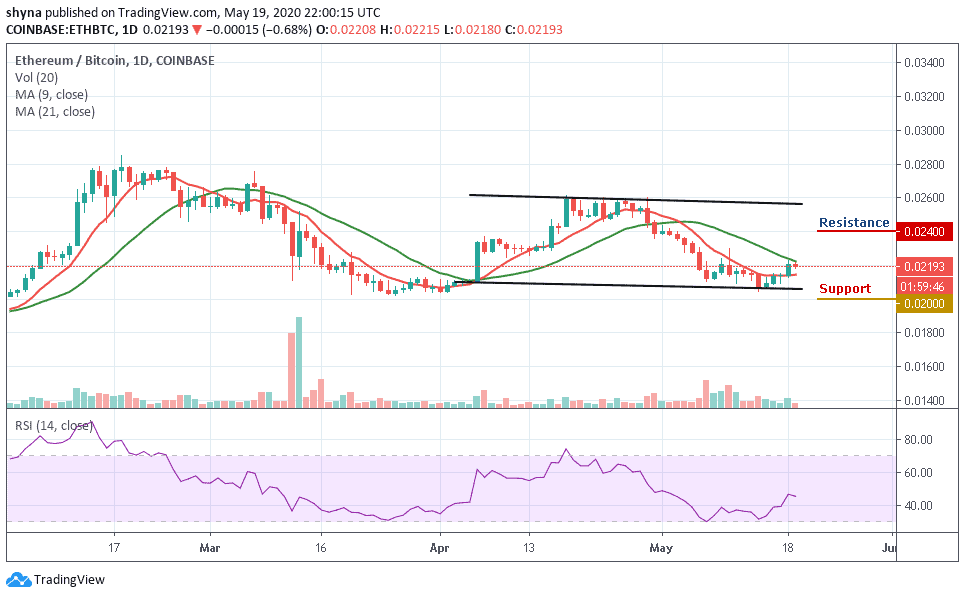
Moreover, when looking from the downside, the nearest levels of support are 0.021 BTC and beneath this, further support lies at 0.020 BTC. If the price drops further to create another low, lower support is located at 0.018 BTC and 0.016 BTC. The technical indicator RSI (14) is moving below the 46-level which indicates that more bearish signals may come into play.
Please note: Insidebitcoins.com is not a financial advisor. Do your research before investing your funds in any financial asset or presented product or event. We are not responsible for your investing results.
Join Our Telegram channel to stay up to date on breaking news coverage