Join Our Telegram channel to stay up to date on breaking news coverage
Market Moves Sideways – June 14
ETH/USD market moves sideways around the main level of $2,500 to now trade at the market value of $2,490 at a rate of about -0.87 percent.
Market Moves Sideways: ETH Market
Key Levels:
Resistance levels: $3,000, $3,500, $4,000
Support levels: $2,000, $1,800, $1,600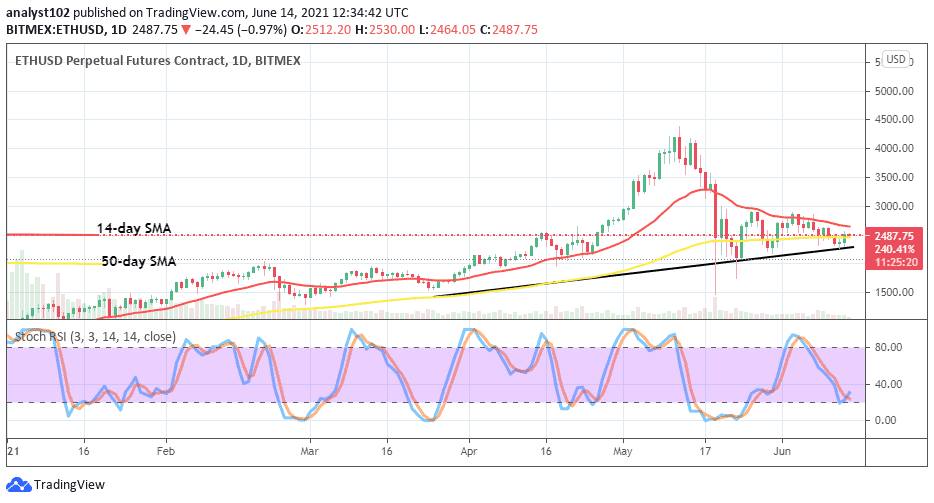
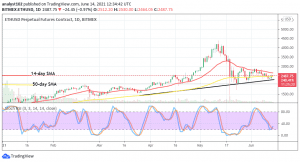
ETH/USD – Daily Chart
The placement of the trading indicators on the ETH/USD daily chart showcases that the crypto market moves sideways predominantly around the level of $2,500. The bullish trend-line drew underneath the SMA s to firmly suggest an upward is in the offing. The 14=day SMA trend-line is located above the 50-day SMA indicator. The Stochastic Oscillators have moved down from the overbought region to cross the lines back upward in between ranges of 20 and 40. That equally signifies the potential return of an upward move in the near time.
The ETH/USD market moves sideways, will there be a sustainable upsurge soon in the price operations?
It now appears that the current featuring of market moves sideways has been to create a decent entry for the ETH/USD bulls to launch a stand. The path-way to the north seems to find support on the buy signal side of the bullish trend-line drew underneath the SMAs. A forceful push to the north could breach past the sell signal side of the smaller SMA to possibly mark another fresh key point to the upside.
Breaking out of the smaller SMA trend-line to the north could in the long-term run of the crypto market makes getting a decent entry for bears difficult in the near time. The kind of signal posture that is currently exhibited by the Stochastic Oscillators appears portending a return of an upward pressure that may be for a notable session’s trading time.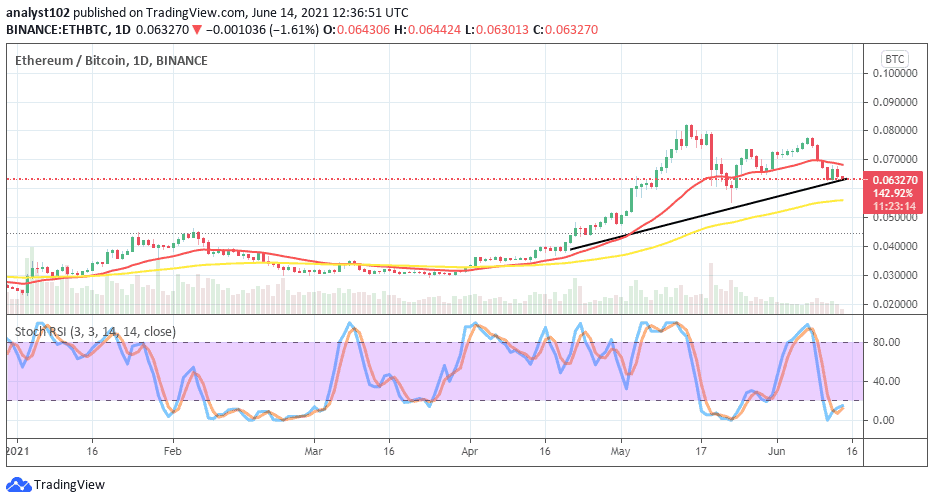
ETH/BTC Price Analysis
On the scale of trend comparison between Ethereum and Bitcoin, the former crypto still possesses more moving capacity than the latter trading instrument. Presently, about a couple of days, the market moves sideways in between the 14-day SMA and the bullish trend-line as the 50-day SMA indicator is located underneath them. They all yet point toward the north. The Stochastic Oscillators are in the oversold region with crossed lines in an attempt to point to the northbound. That signifies the possibility that the base crypto may soon regain its trending weight as paired with the flagship counter cryptocurrency.
Looking to buy or trade Bitcoin (BTC) now? Invest at eToro!
75% of retail investor accounts lose money when trading CFDs with this provider
Join Our Telegram channel to stay up to date on breaking news coverage
