Join Our Telegram channel to stay up to date on breaking news coverage
Ethereum Price Prediction – June 14
The Ethereum price is likely to lose ground towards $2450 but the recovery above $2500 could help to mitigate the initial pressure.
ETH/USD Market
Key Levels:
Resistance levels: $3100, $3300, $3500
Support levels: $1800, $1600, $1400
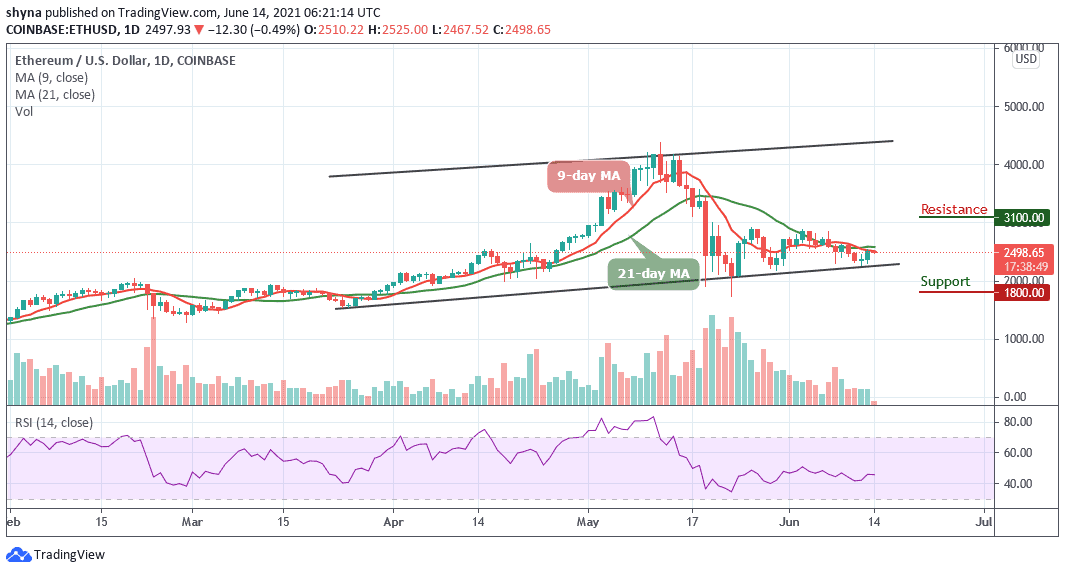
At the time of writing, ETH/USD displays just enough power to defend the support at $2450. All the attempts made towards recovery since the dip to $2250 have bowed to the selling activity under $2300 a couple of days ago. At the time of writing, the Ethereum price is hovering at $2498 after a 0.49% loss on the day. In the short term, bearish momentum is very likely especially if the bulls fail to hold the price above $2500 and the support at the lower side of the channel is broken.
Ethereum Price Prediction: What is the Next Move?
The Ethereum price would now need to rise and break above $2500 before resuming the previous bullish trend and would still need to break beneath the lower boundary of the channel at $2200 before turning bearish. Therefore, if the sellers push lower, traders can expect very strong support at $2000; this is then followed up with support at $1900. If the bears push further below this support, then additional supports may be located at $1800, $1600, and $1400.
On the other hand, if the buyers regroup and rebound from $2450, the first level of resistance lies at $2800. This is then followed by resistance at $3100, $3300, and $3500 while the Relative Strength Index (14) is at the 46-level to indicate indecision within the market. If the technical indicator dips beneath this level, the Ethereum price may head lower beneath $2400 and possibly toward $2200.
When compares with Bitcoin, the Ethereum price keeps trading as the bears are still dominating the market. ETH/BTC is currently trading at 6343 SAT and the bulls couldn’t push the price to the north. However, if the price drop below the lower boundary of the channel, the next key supports may likely be at 5200 SAT and below.
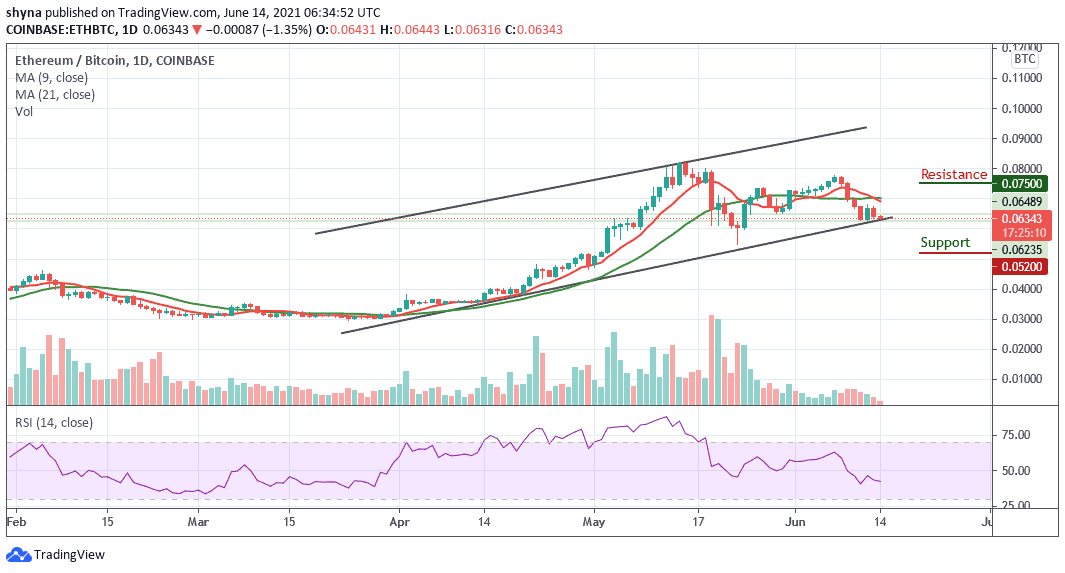
In other words, a possible bullish movement could push the market towards the moving averages of 9-day and 21-day within the channel, a break above this may enable ETH to reach a high of 7500 SAT and above but the Relative Strength Index (14) is moving around 45-level, which shows that the market might experience a sideways movement.
Looking to buy or trade Ethereum (ETH) now? Invest at eToro!
75% of retail investor accounts lose money when trading CFDs with this provider
Join Our Telegram channel to stay up to date on breaking news coverage