Join Our Telegram channel to stay up to date on breaking news coverage
ETH Price Prediction – November 8
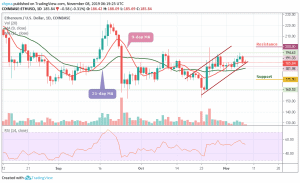
Ethereum (ETH) is back to moving within a bearish pennant structure, subject to further potential downside pressure.
ETH/USD Market
Key Levels:
Resistance levels: $200, $205, $210
Support levels: $170, $165, $160
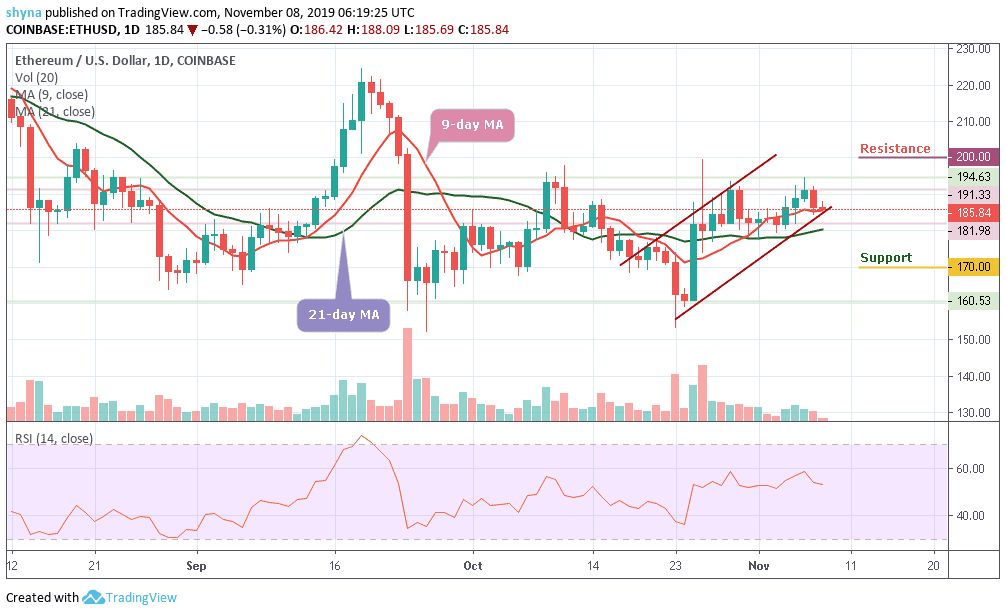
ETH/USD is back in the $180’s range following the bulls’ inadequacy to clear the resistance at $194. The tentative support at $190 did not match up to the selling pressure whereby the declines touched $186 which happens to be the intraday low. Besides, the 9-day moving average did little to halt the drop at the moment while the 21-day moving average still serves as another support.
More so, the technical signal by the RSI (14) suggests that the bears may continue to remain in control. If the indicator dives towards the oversold levels under 30, Ethereum could breakdown to the primary support at $175. For now, a sideways movement between $181 and $191 could be a welcomed move which may likely allow the buyers to forge another attack on $200, $205 and $210 resistance level in the coming sessions.
However, if the price drops below the $175 support, the coin is likely to locate the critical support at $170 which is a close support level for the bears. A bearish continuation could bring the market to $165 and $160 support levels, retesting the October 25 low. Nevertheless, the trend remains dominant bearish bias in the long-term.
Comparing with Bitcoin, the recent price decline continued to place the ETH/BTC pair in a downward trend after witnessing a bullish price action a few days, indicating an undecided market. The price action is still trading below the 21-day moving average while the 9-day moving average still serves as close support. Looking at a long-term bear market, the 1940 SAT, 1935 SAT and 1930 SAT could provide further support levels for the next selling pressure.
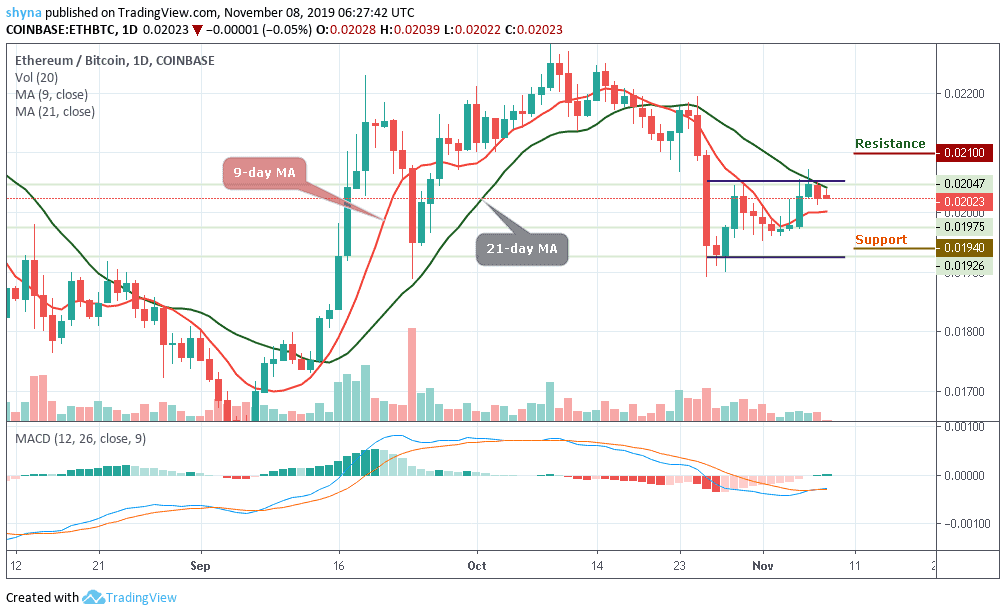
Moreover, between yesterday and today, the Ethereum price fell to the 2023 SAT following a sudden rise in the downtrend. Now, we can say that the sellers may likely return to the market after a little indecisive appearance. However, if the 2000 SAT can act as a solid line of defense against any further downtrend; buy pressure at 2100 SAT, 2150 SAT and 2200 SAT resistance levels can be expected. The MACD is currently on the negative side.
Please note: Insidebitcoins.com is not a financial advisor. Do your research before investing your funds in any financial asset or presented product or event. We are not responsible for your investing results.
Join Our Telegram channel to stay up to date on breaking news coverage