Join Our Telegram channel to stay up to date on breaking news coverage
ETH Price Prediction – November 3
Ethereum failed to find support at $185, as seen on the daily chart, the price brought declines to $180 with a loss of 1.32%.
ETH/USD Market
Key Levels:
Resistance levels: $200, $210, $220
Support levels: $160, $150, $140
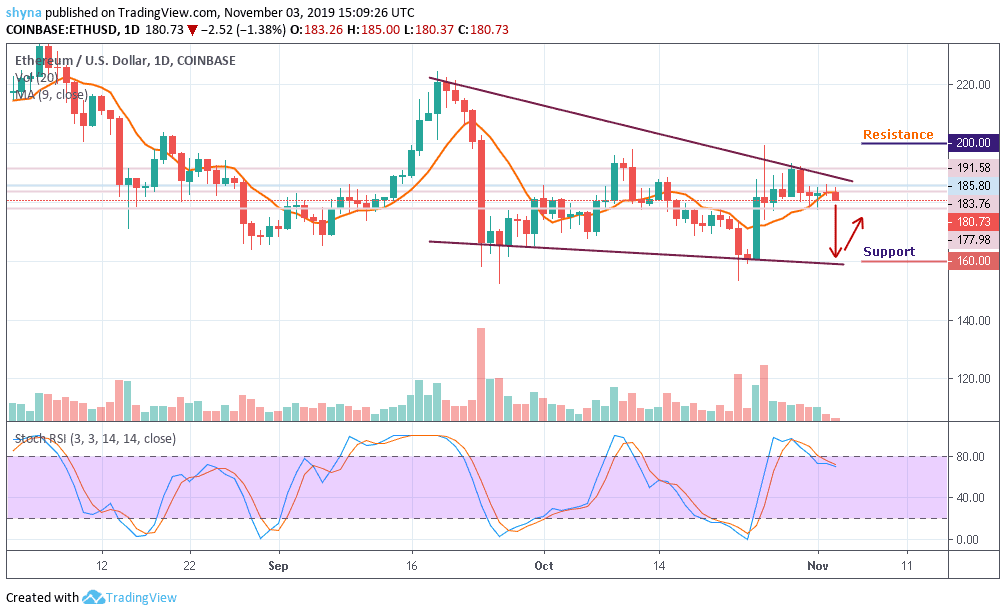
As the market opens today, ETH/USD broke the $183 mark after an unsuccessful attempt to settle above $185. ETH/USD is currently changing hands at $180.73, down 1.32% on a daily basis and since the beginning of the day. The bulls have so far been hit by the rejection of the main barrier at $195, heading towards the potential of the daily double bottom.
Looking at the daily chart, the initial support is created around the 9-day moving average at $183.76. Once this is eliminated, the sell-off may increase with the next focus on the $175 level. If this support level drops, the downward momentum could begin to snowball and the next downside target to $165. ETH/USD is powered by the lower line of the channel and the closest supports to watch are $160, $150 and potentially $140.
On the upside, the recovery is limited by the moving average on the daily chart at $191. However, the bulls must realize the need to clear the $185 level before they can get to the upper side of the channel and reach the intraday high of $194. Above this handle, we will need to consider a sustained move for the extended recovery to the resistance levels at $200, $210 and $220. Meanwhile, the stochastic RSI has fallen sharply from the overbought zone due to the current downtrend in the market.
When compared with Bitcoin, we can see that Ethereum is clearly bearish. As the price falls, sellers are posing an additional threat for buyers to reach the support level of 0.0195 BTC where the nearest target is located. However, an eventual break below the 9-day moving average may cause Ethereum to collapse.
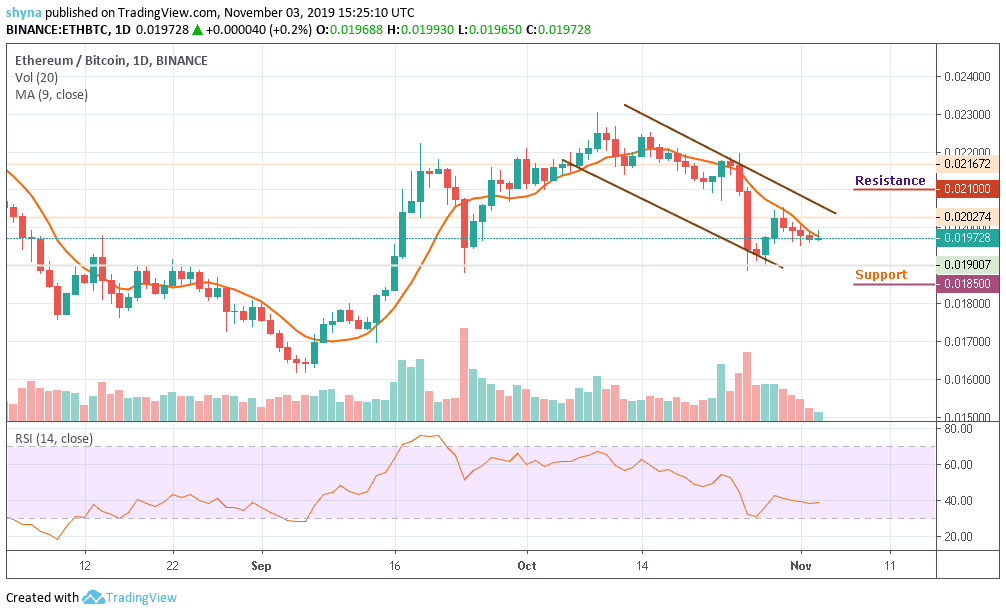
Meanwhile, a continuation of the downtrend could hit the main support at 0.0185 BTC before falling to 0.0180 BTC and below, while the buyers could probably push the market to the critical potential resistance at 0.0210 BTC and above. The RSI has dipped beneath the 40-level indicating that the sellers are in control over the market momentum.
Please note: Insidebitcoins.com is not a financial advisor. Do your research before investing your funds in any financial asset or presented product or event. We are not responsible for your investing results.
Join Our Telegram channel to stay up to date on breaking news coverage