Join Our Telegram channel to stay up to date on breaking news coverage
ETH Price Prediction – January 23
Ethereum revives downward action following a failed attempt to trade above $170 level.
ETH/USD Market
Key Levels:
Resistance levels: $178, $180, $182
Support levels: $148, $146, $144
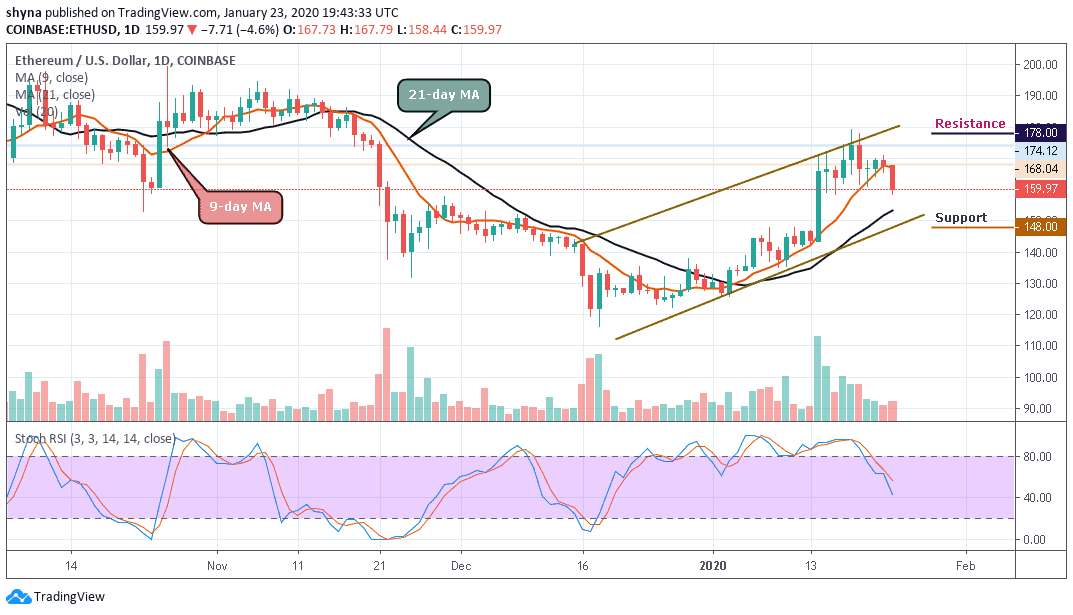
ETH/USD broke the $165 level after an unsuccessful attempt to settle above $170 as the market opens today. ETH/USD is currently changing hands at $159.97, down 4.6% on a daily basis and since the beginning of the day. The bulls have so far been hit by the rejection of the main barrier at $175, heading towards the potential of the daily double bottom.
Looking at the daily chart, the initial support is created at around $155. Once this is eliminated, the sell-off may increase with the next focus on the $150 level. If this support level drops, the downward momentum could begin to snowball and ETH/USD is powered by the lower line of the channel while the closest supports to watch are $148, $146 and critically $144.
On the upside, the recovery is limited by the moving average on the daily chart at $169. However, the bulls must realize the need to clear the $175 level before they can get to the upper side of the channel to reach the intraday high of $180. Above this handle, we will need to consider a sustained move for the extended recovery to the resistance levels at $178, $180 and $182. Meanwhile, the stochastic RSI has fallen sharply from the overbought zone due to the current downtrend in the market.
Against Bitcoin, the market price remained in the ascending movement since December 26, currently trading at the level of 1923 SAT and expecting a break below the 9-day moving average. Looking at the chart, we can see that the market is still maintaining an upward trend. If the market continues to fall, the next key supports may likely be at 1820 SAT and below.
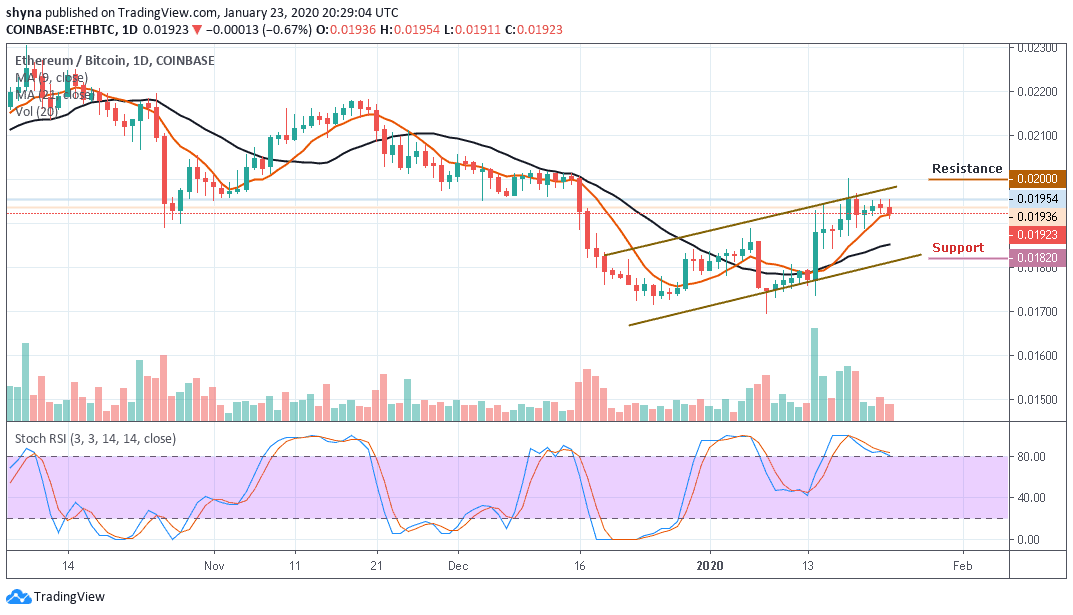
However, on the upside, a possible rise could take the market above the moving averages and the nearest resistance level of 2000 SAT and above could be visited. According to the stochastic RSI, the signal lines face a downward trend, which could trigger more bearish signals in the market soon.
Please note: Insidebitcoins.com is not a financial advisor. Do your research before investing your funds in any financial asset or presented product or event. We are not responsible for your investing results.
Join Our Telegram channel to stay up to date on breaking news coverage