Join Our Telegram channel to stay up to date on breaking news coverage
ETH Price Prediction – January 28
Ethereum price consolidating above $170 could lead to a run-up to $190 in the near term.
ETH/USD Market
Key Levels:
Resistance levels: $185, $190, $195
Support levels: $155, $150, $145

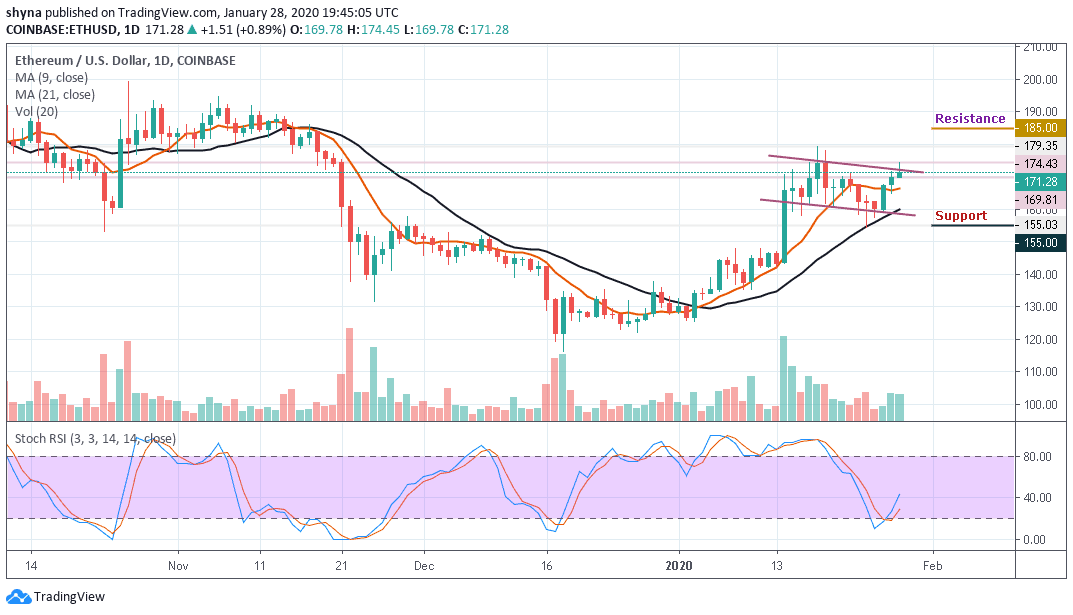
ETH/USD has been gaining ground for three days in a row. The coin hit an intraday high at $174.43 but retreated to $171.28 at the time of writing. Despite the downside correction, ETH/USD is still nearly 0.89% higher on a day-to-day basis. At the moment, Ethereum (ETH) is trading at $171.28 while testing an ascending channel resistance. However, the value of the crypto has grown after opening the session at $169.81.
However, the initial support is created below the 9-day moving average at $165. Once this is eliminated, the sell-off may increase with the next focus on the $160 level. If this support level drops, the downward momentum could begin to snowball and the next downside target to $155. ETH/USD is powered by the lower line of the channel and the closest supports to watch are $150 and $145.
Moreover, as the daily chart reveals, the bulls must realize the need to clear the $175 level before they can get to the potential resistance levels. Above this, traders will need to consider a sustained move for the extended recovery to the resistance levels at $185, $190 and $195. Meanwhile, the stochastic RSI has just recovered from the oversold zone, which may give more supports to the bulls.
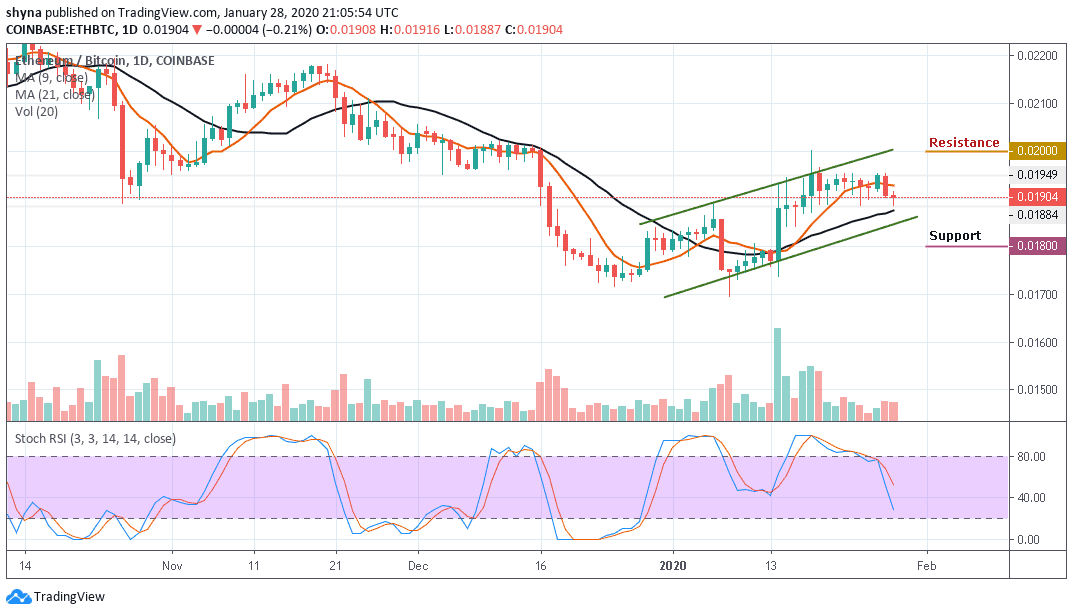
Against Bitcoin, the recent price decline continued to place the ETH/BTC pair in a downward trend after witnessing a bullish price action a few days, indicating an undecided market. The price action is still trading below the 9-day moving average while the 21-day moving average still serves as close support. As the stochastic RSI nosedives to the south, the 1800 SAT, 1750 SAT and 1700 SAT could provide further support levels for the next selling pressure.

Moreover, between yesterday and today, the Ethereum price fell to the 1904 SAT following a sudden rise in the downtrend. Now, we can say that the sellers may likely return to the market after a little indecisive appearance. However, if the 1900 SAT can act as a solid line of defense against any further downtrend; buying pressure at 2000 SAT, 2050 SAT and 2100 SAT resistance levels can be expected.
Please note: Insidebitcoins.com is not a financial advisor. Do your research before investing your funds in any financial asset or presented product or event. We are not responsible for your investing results.
Join Our Telegram channel to stay up to date on breaking news coverage

