Join Our Telegram channel to stay up to date on breaking news coverage
ETH Price Prediction – February 13
Today, the Ethereum bulls scatter as sellers swing into action amid calls for revenge, the bearish action targets resistance turned support at $240.
ETH/USD Market
Key Levels:
Resistance levels: $298, $303, $308
Support levels: $224, $219, $214

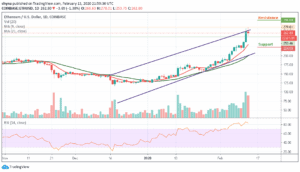
Since the beginning of the year, ETH/USD has more than doubled in value. Unfortunately, the surge that started yesterday fizzled under a $275 level. Sustaining upside action became incredibly difficult especially amid the widespread correction in the market. The second-largest crypto dived under a couple of key support levels at $275 and $260. At the time of writing, the bulls are trying to find balance at $265 and hopefully place the crypto back in the trajectory towards $280 and eventually $290.
However, at the time that the market opens today, ETH/US price rose further higher from $266.62 until it finds resistance at the expected level of $$275. Looking at the daily chart, we can see that ETH/USD even spiked higher into the resistance level at $279.01. Therefore, if the buyers continue to push the market higher, the immediate resistance above $285 level will be located. Above this, further resistance levels lie at $298, $303 and $308.
In other words, as reveals by the daily chart, if the bears bring down the price below the 9-day moving average, the coin may expect immediate support to be located at $228 which is below the 9-day moving average. Below $228, further support is found at $224, $219 and $214. Meanwhile, RSI (14) is moving extremely within the overbought, suggesting more bullish signals into the market soon.
When compared with BTC, ETH is still trading well above the 9-day and 21-day moving averages and the price is now hovering at 2590 SAT as the technical indicator RSI (14) swims within the overbought zone. However, the bulls remain the dominant of the market at the moment as the pair seems to be moving around the upper boundary of the channel.

At the upside, the resistance levels to be reached are found above the ascending channel at 2900 SAT and 3000 SAT. Conversely, a lower sustainable move may likely cancel the bullish pattern and this could attract a new seller to the market with the next focus at 2300 SAT and 2200 SAT.
Please note: Insidebitcoins.com is not a financial advisor. Do your research before investing your funds in any financial asset or presented product or event. We are not responsible for your investing results.
Join Our Telegram channel to stay up to date on breaking news coverage

