Join Our Telegram channel to stay up to date on breaking news coverage
ETH Price Prediction – May 6
The Ethereum price saw a 1.25% price hike today as the coin rises to the $211 level.
ETH/USD Market
Key Levels:
Resistance levels: $200, $205, $210
Support levels: $130, $125, $120

At the beginning of this month, ETH/USD has been trading within a range of $215 and $194. The daily chart reveals that the coin pushed higher today from the $202 level as it reached $211 before coming back to where it is currently trading at $208. However, it is important to take note that this is not a push from the ETH bulls but rather a result of BTC breaking above $9,000 again.
Nevertheless, ETH/USD is moving upward, but it still has to face the resistance at $220 if it wants to continue the upward movement. More so, the Ethereum (ETH) remains in a bullish position despite being predictably rejected from the $220 level of resistance a few days ago. Meanwhile, as long as the world’s second-largest cryptocurrency continues to trade above $200 in the short term, it presents more of a chance of upside price action, although a break below would signal a new bearish phase in the market.
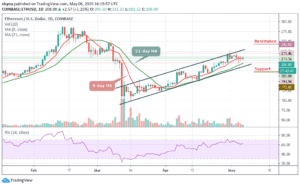
Furthermore, as long as the 9-day moving average remains above the 21-day moving average, traders can expect ETH/USD to consolidate at higher levels. That’s if we could see a further climb above the $220 which is fast approaching; it may likely reach the resistance at $242, $247, and $252 levels. Meanwhile, the critical support levels to watch for lie at $172, $168, and $163 respectively as the technical indicator RSI (14) moves above 60-level.
When compared with BTC, Ethereum (ETH) is currently changing hands at 0.0224 BTC following a bearish moment at the time the market opens today. Looking at the daily chart, the current trend of the coin is perpetually looking bearish in the short-term, moving below the 9-day and 21-day moving averages within the channel.

Meanwhile, the resistance levels to look for are 0.025 BTC and 0.026 BTC while the closest support levels to keep an eye on are 0.0195 BTC and critically 0.0185 BTC. The RSI (14) is moving below 40-level, which could continue to give bearish signals in the nearest term.
Please note: Insidebitcoins.com is not a financial advisor. Do your research before investing your funds in any financial asset or presented product or event. We are not responsible for your investing results.
Join Our Telegram channel to stay up to date on breaking news coverage