Join Our Telegram channel to stay up to date on breaking news coverage
Today’s forecast will discuss activities in the ETH/USD and ETH/BTC markets. Also, we’ll look at what to expect from this market, going by signs displayed on trading indicators. At this point, we can say that the price movements in the Ethereum/Bitcoin and Ethereum/US dollars are quite similar.
Ethereum Coin Forecast Statistics Data:
Ethereum Coin’s price now: $1626
Ethereum Coin’s market cap: $197.6 billion
Ethereum Coin circulating supply: 121.8 million
Ethereum Coin’s total supply: —–
Ethereum Coin Coinmarketcap ranking: #9
Important Levels:
Top levels: $1,600, $1,630, $1,700
Base levels: $1,680, $1,665, $1,626

Both markets are in a downtrend, after a significant upside rally. Nevertheless, it appears as if the ETH/BTC market is performing better than the ETH/USD. Although both ETH market has put on impressive performances until now, still let’s see what to expect from this point.
Ethereum Coin Value Forecast: ETH Has Started a Downtrend
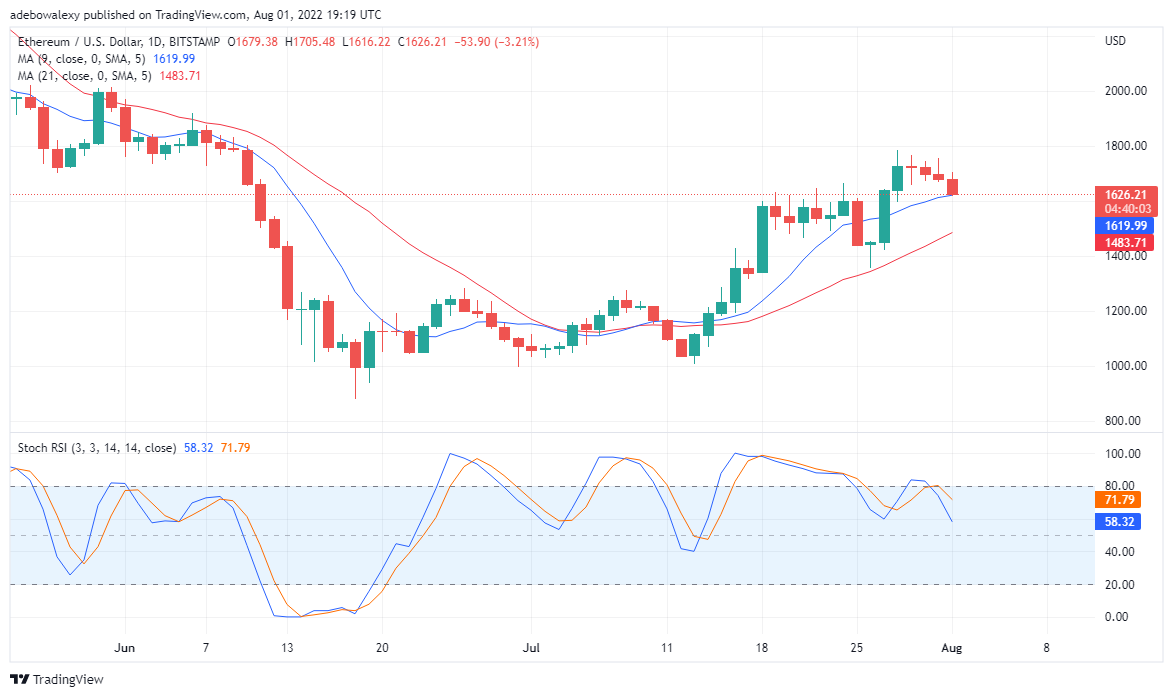
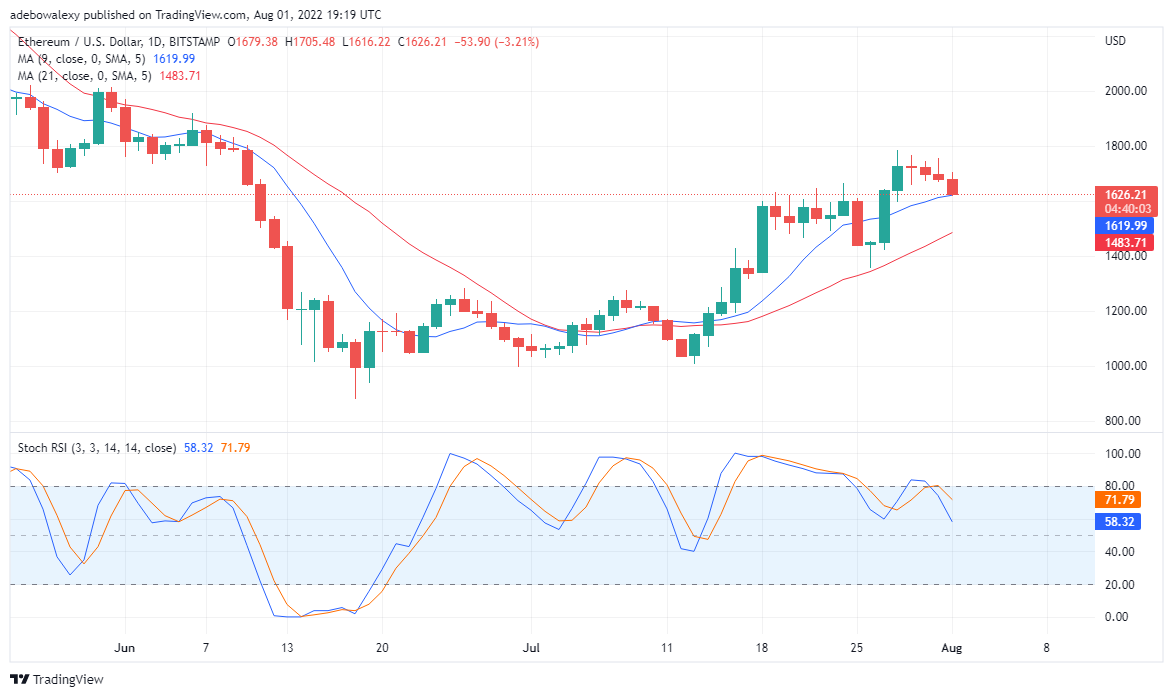
ETH/USD daily chart portrays a bearish market. This is confirmed by trading indicators on this chart. Although the moving average lines remain under price motion, subsequent candle formation stays bearish. Soon, the price candle will find its way under the quicker MA lines and a further downward trend may continue from there, till lower support is found.
Also, the Stochastic Relative Strength Indicator confirms that the downward correction is strong. The indication that this could be a strong downtrend stems from the fact that the indicator threads have crossed in this overbought region. Also, this Thread appears to be steeply pointing downwards. Consequently, this is telling that the trend is likely strong. Additionally, this may bring the value of this Ethereum market to support $1,400 or $1,300.
Ethereum Coin Value Forecast: ETH is Still on a Downward Correction Against Bitcoin
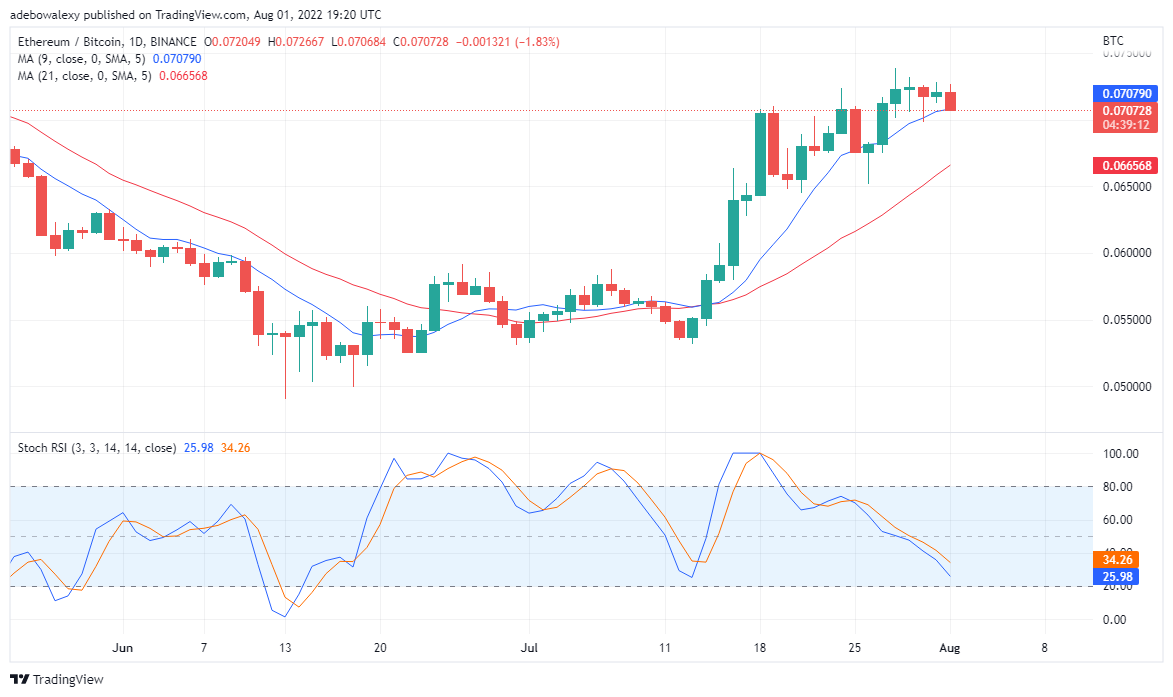
Although the ETH/BTC market has experienced a steeper upside gain in value. Currently, it has started a downward trend. The latest bearish candle has touched the faster MA line, while the. However, the downtrend seems to be weakening since the Stochastic Relative Strength Indicator shows that the trend has already reached the oversold area.
Although this indicator is showing no signs of an upward correction yet it will likely correct sooner. This is because of the oversold region already. Furthermore, lower support will be found, but fact remains that may not be too far from the current price level. Consequently, Ethereum’s new support may be around $0.067.
Join Our Telegram channel to stay up to date on breaking news coverage


