Join Our Telegram channel to stay up to date on breaking news coverage
The Ethereum Classic price prediction reveals that ETC faces key support as the market price may gain more downs.
Ethereum Classic Prediction Statistics Data:
- Ethereum Classic price now – $27.41
- Ethereum Classic market cap – $3.7 billion
- Ethereum Classic circulating supply – 137.1 million
- Ethereum Classic total supply – 210 million
- Ethereum Classic Coinmarketcap ranking – #22
ETC/USD Market
Key Levels:
Resistance levels: $40, $45, $50
Support levels: $20, $15, $10
Your capital is at risk
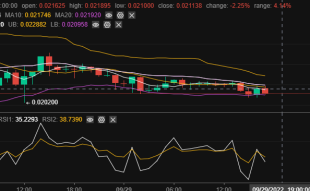
As the market opens today, after touching the resistance level of $28.25, ETC/USD drops with a bearish bias. The coin opens at $27.58, and it is currently dropping toward the support level of $26. For the past few days, the Ethereum Classic price has been moving sideways and touching many supports. The market price could correct higher, but it is likely to face more sellers below the lower boundary of the channel.
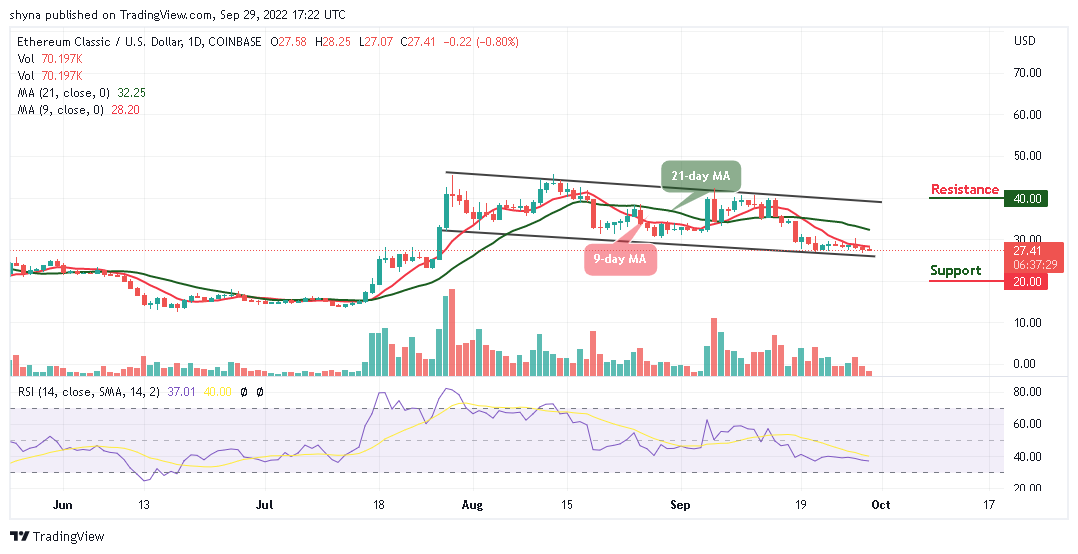
ETC Price Prediction: What to Expect from ETC
At the time of writing, the Ethereum Classic price is moving sideways, and the coin is likely to break down heavily to gain more downtrends because the red line of the 9-day moving average stays below the green line of the 21-day moving average. However, the coin is currently hovering at $27.41 as it prepares to cross below the lower boundary of the channel. Should it spike below the channel, the critical support levels of $20, $15, and $10 may be tested as the technical indicator Relative Strength Index (14) moves below the 40-level.
Moreover, with a look at things, the crypto could either recover above the 9-day moving average or extend its decline towards the support level of $23. On the upside, the next major resistance is near the $30 level. Meanwhile, the price needs to climb above the $40, $45, and $50 resistance levels to move back into a positive zone. If not, there is a risk of more downsides below the channel.
Against Bitcoin, the daily chart reveals that the ETC price is hovering below the 9-day and 21-day moving averages. If the price crosses above the moving averages, there is a possibility that the coin may begin the upward trend. The next resistance key above this level is close to the 1443 SAT level. If the price rises, it could even break the 2000 SAT and above in future sessions.
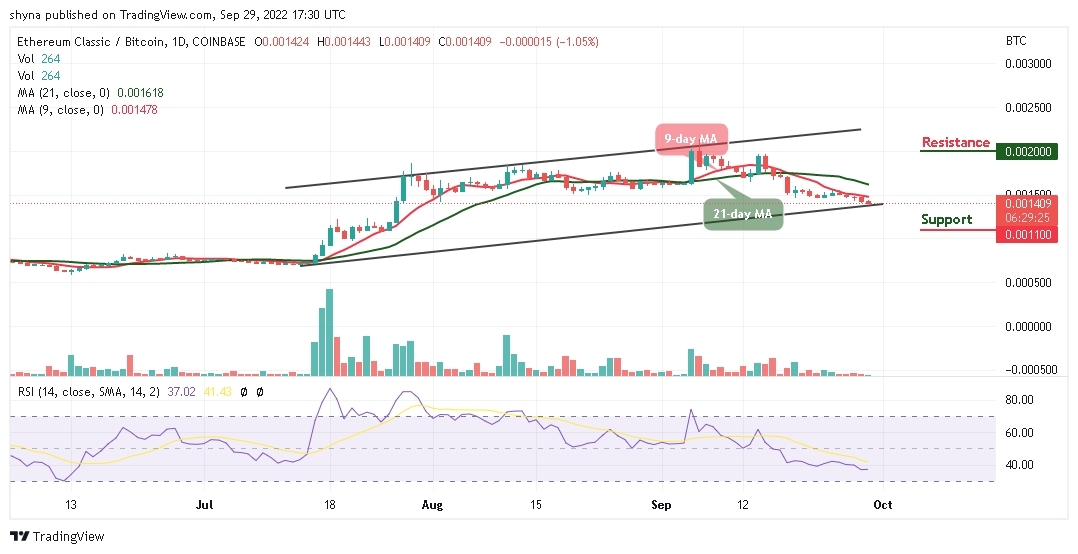
Meanwhile, if the bears push the price below the lower boundary of the channel, 1200 SAT support may play out. Any further bearish movement could roll the coin to the critical support at 1100 SAT and below. The Relative Strength Index (14) is moving below 40-level, suggesting bearish signals.
Join Our Telegram channel to stay up to date on breaking news coverage