Join Our Telegram channel to stay up to date on breaking news coverage
ETH Price Prediction – May 2
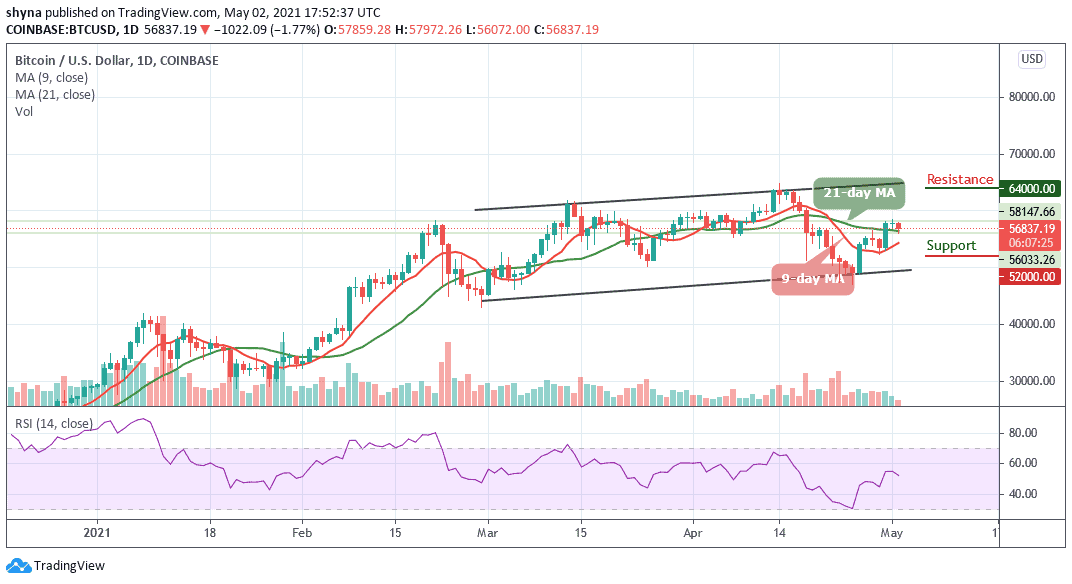
Ethereum (ETH) kicked off its rally with a break above the key resistance level around $2950 as the coin continues to spike higher to touch the $2979 resistance.
ETH/USD Market
Key Levels:
Resistance levels: $3200, $3300, $3400
Support levels: $2600, $2500, $2400
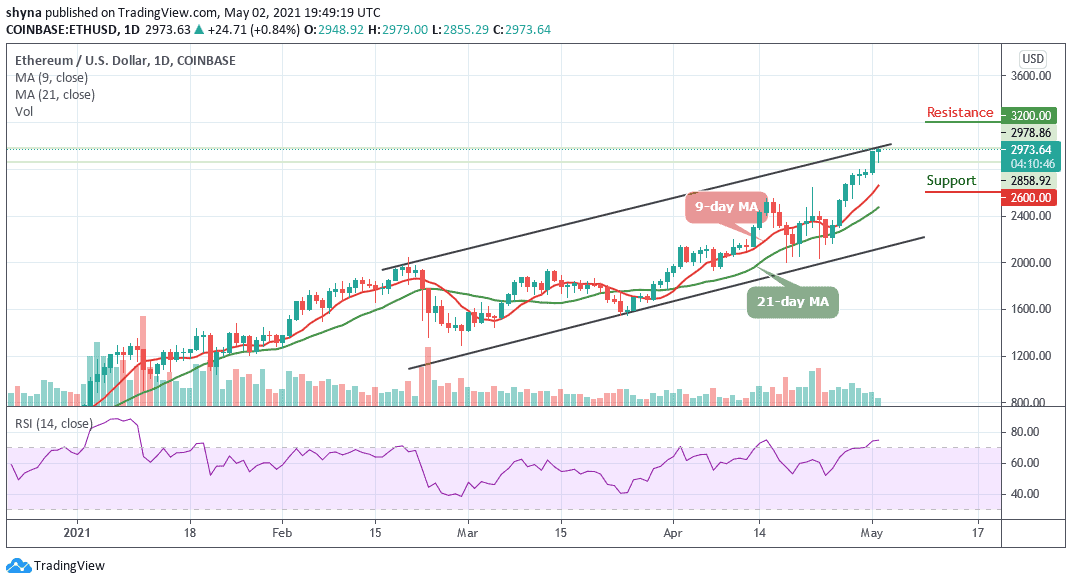
Yesterday, ETH/USD had a significant boost that allowed the coin to exceed the $2950 level, this momentum extending considerably as crypto continues to climb higher today. The current performance of the coin indicates the addition of an upward movement ago. It’s just a matter of time for this coin to reach a $3000 level in the nearest term.
What to Expect from Ethereum
In the last few days, Ethereum has moved from $2216 to $2979 and at the same time moving towards the upper boundary of the channel at the time of writing. The ongoing trend may move a little bit higher before entering into the new week, and the coin may likely reach the nearest resistance at $3200, but if the bulls put more effort, it could hit additional resistance levels at $3300 and $3400 respectively.
However, a bearish drop may roll the market back below the 9-day and 21-day moving averages and also to the initial support level of $2800. Meanwhile, the support levels to watch are $2600, $2500, and $2400. As the trading volume increases, the technical indicator RSI (14) is seen moving within the overbought region and this could still supply more bullish signals into the market.
When compared with Bitcoin, Ethereum is still trading near the upper boundary of the channel above the 9-day and 21-day moving averages. The price is changing hands at 5255 SAT as the technical indicator RSI (14) moves into the overbought zone. However, the daily chart reveals that the buyers continue to dominate the market as the pair seems to break above the channel.
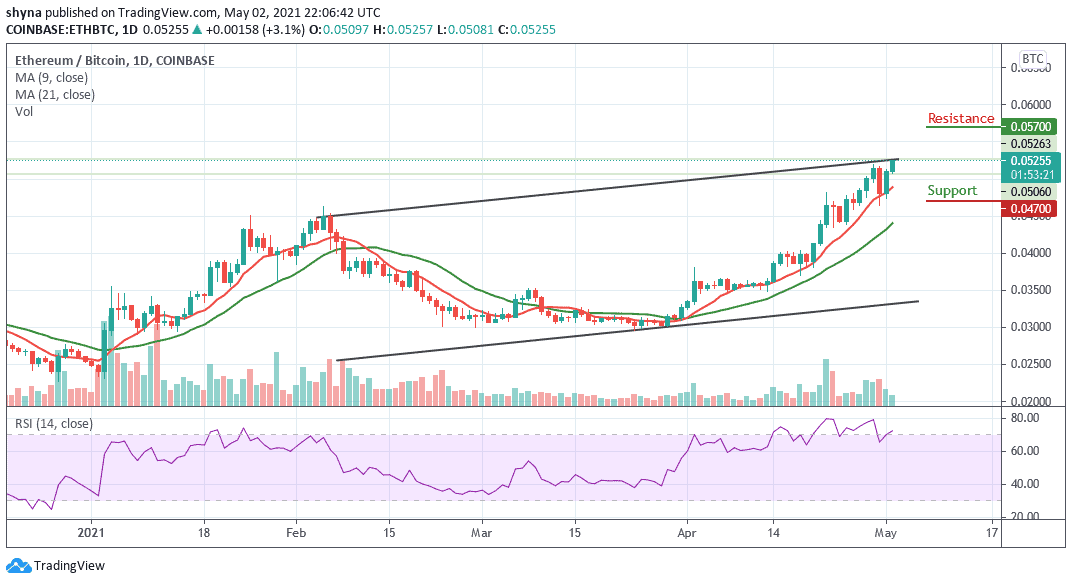
Positively, the resistance levels to be reached are 5700 SAT and above. Conversely, a lower sustainable move may likely cancel the bullish pattern and it could attract new sellers to the market with the next focus on 4700 SAT and below.
Join Our Telegram channel to stay up to date on breaking news coverage